The Baptist
Established member
- Messages
- 715
- Likes
- 45
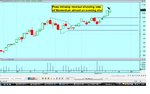
Hopefully the chart Labels cover all the aspects of this BO.
Happy Equity trading.
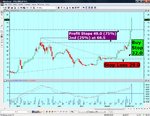
better chart
Hopefully the chart Labels cover all the aspects of this BO.
Happy Equity trading.
Baptist, I scanned a few charts last week and identified Kazakhmys PLC as a potential breakout trade. It broke above 1000 a few days ago and is now around 1100, I was just wondering if you would've taken this trade and if so how you would have played it?
Also keeping an eye on Rio Tinto, Aviva, International Power, Man Group, Sage Group and BT.
Will take a peek at aforementioned, I am largely flat and will starts scanning again.
Rio has crossed into a BO for me already, I like Aviva most advanced of others.
Can get into more detail offline.
On what basis do you conduct scans, ie front end and features you look for.
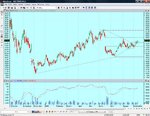
I decided to manually scan the FTSE 100 a few days ago looking for potential BO setups after reading your thread. I looked at daily candles going back about 2 years, drew on major levels of resistance and then added them to my shortlist if price was approaching this level.
For example, you said that Rio has already crossed into a BO for you. I have a horizontal resistance level drawn in at 2640, tested 4 times in the past year nearly to the pip, price is at this level right now.
I've never used a BO strategy before, just see it as a good way of entering a trade in the current environment. Therefore I haven't commited any money to it yet and am just keeping an eye on my shortlist to see how companies react at various price levels.
Thanks for that. I'm not in myself due to lack of BO experience but I think your post just doubled my knowledge of this kind of setup!
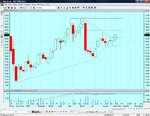
According to my feed, today's candle gapped down and made a low at 2527, before retracing back to 2603. Even though the previous candle wasn't bearish, would you still consider this a bullish belt hold of sorts?
Edit: What is my finders fee?