My system is combine TA with intermarket analysis.
I usually trade on Tf 15 and only trade EURUSD pair
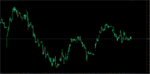
I use Broco MT4 chart to check Bond chart TF 15
But it's very slow and not clear enought to see candlestick like other Stock or USD index.
Can anyone help me to find any broker MT4 or other chart to see the move of Bond clearer in short TF 15?
Thanks u very much.
I usually trade on Tf 15 and only trade EURUSD pair
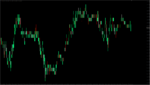
I use Broco MT4 chart to check Bond chart TF 15
But it's very slow and not clear enought to see candlestick like other Stock or USD index.
Can anyone help me to find any broker MT4 or other chart to see the move of Bond clearer in short TF 15?
Thanks u very much.