You are using an out of date browser. It may not display this or other websites correctly.
You should upgrade or use an alternative browser.
You should upgrade or use an alternative browser.
madasafish
Well-known member
- Messages
- 470
- Likes
- 5
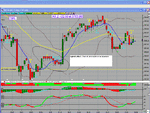
I use a 9 period exponential 1.8standard deviation in all time frames..
When they narrow.. move coming
when they curve up at low and stochastics turn up.. up trends.. When the price pokes up through top when flat == down move..
See attached "squish move"
When they narrow.. move coming
when they curve up at low and stochastics turn up.. up trends.. When the price pokes up through top when flat == down move..
See attached "squish move"
Attachments
madasafish
Well-known member
- Messages
- 470
- Likes
- 5
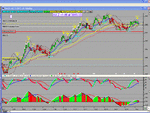
the "bubbles" are (green) 9 ema lower, red 9 ema upper..
When cl>9ema, green bubbles, when <9ema red bubbles..
you can see when to take profits.. if the price goes below green when long and does not recover...
I NEVER go long if price is <9ema in 1 minute chart (except at V bottoms of course..)
Much better guide than ema crossovers..
When cl>9ema, green bubbles, when <9ema red bubbles..
you can see when to take profits.. if the price goes below green when long and does not recover...
I NEVER go long if price is <9ema in 1 minute chart (except at V bottoms of course..)
Much better guide than ema crossovers..
hi all
Only just noticed this thread and since Bollingers are one of my favourite indicators, I thought I should put my 2 cents worth in!!
Just remember that I trade EOD not intraday so this might colour my remarks.
All indicators are brilliant in hindsight and bollingers are no different. Just remember that this is a statistical measure of the prices and their volatility.
10 period ma is too short. I use the normal 20 sma and it works fine. The 2 standard Deviation bands means that 95% of all prices should fall in the bands. You could try tightening them up a bit but 2 seems to give a reasonable picture.
They work better with some stocks then others so it might be the same with futures. i.e. mini dow good - ESTX useless.
Narrowing normally means volatility to come.
If they fall/rise at 45+ degrees and the price is outside the band, it's staying there so ride the elevator.
Look for "clinging and swinging"
Look for Outside /inside signals.
Check out the support and resistance and trendlines as the band moves towards them. Use the bands with other information. nothing works in isolation.
sorry for the quick post - hope it makes sense.
madasafish
Well-known member
- Messages
- 470
- Likes
- 5
I'm using such short time spans for Bbs as I want an instant respons.. I'm daytrading DAX on a 20tick bar chart and looking to scalp as much as I can.. so fine tuning to the 2-3 points is very important..(which is rather difficlt on DAX but not impossible).
see the attached example and note how the moves in BBs (the black lines ) foretell what is likely to happen..
see the attached example and note how the moves in BBs (the black lines ) foretell what is likely to happen..
Attachments
OK OK I stand corrected!!
Nice chart; the price breaking away from the BB on it's way to the other band is really clear.
There's also lots of nice information from Support and resistance as well.
BTW - sorry about the dig at ESTX but as I said I'm not a futures trader. Seems that the DAX has reasonable volatility.
Nice chart; the price breaking away from the BB on it's way to the other band is really clear.
There's also lots of nice information from Support and resistance as well.
BTW - sorry about the dig at ESTX but as I said I'm not a futures trader. Seems that the DAX has reasonable volatility.
esiotrot
I think the key point is the one you made about it working for some and not for others. I have examples (and the one mad posted is better than any of them) of where it's a great predictor, and others when it breaks the upper or lower after narrowing then veers in the opposite direction, in some cases swinging back and continuing that trend soon afterwards . Unless we just want to be wise after the event (maybe academically interesting but not very profitable!!) we have to backtest any technique we use on individual stocks and indices; see what works and what doesn't, then have the courage of our convictions going forward. Good thread
I think the key point is the one you made about it working for some and not for others. I have examples (and the one mad posted is better than any of them) of where it's a great predictor, and others when it breaks the upper or lower after narrowing then veers in the opposite direction, in some cases swinging back and continuing that trend soon afterwards . Unless we just want to be wise after the event (maybe academically interesting but not very profitable!!) we have to backtest any technique we use on individual stocks and indices; see what works and what doesn't, then have the courage of our convictions going forward. Good thread
"For good info on use of BB's see Master Swing Trader by Alan Farley. Though I could not understand much of book, much less use it practically, he is an acknowledged expert."
those comments about this book have to got to be the most on the money comments that would just about cover every trading book ever produced
those comments about this book have to got to be the most on the money comments that would just about cover every trading book ever produced


