You are using an out of date browser. It may not display this or other websites correctly.
You should upgrade or use an alternative browser.
You should upgrade or use an alternative browser.
BLS
Established member
- Messages
- 642
- Likes
- 229
Week 3 charts from Volman:
https://www.dropbox.com/sh/1amxmi9af0fk6ej/VA5_ZrjQF1
https://www.dropbox.com/sh/1amxmi9af0fk6ej/VA5_ZrjQF1
matty_dunn
Active member
- Messages
- 188
- Likes
- 17
Week 3 charts from Volman:
https://www.dropbox.com/sh/1amxmi9af0fk6ej/VA5_ZrjQF1
Thanks Bob and BLS. Really appreciate all the extra notes this week Bob. What you do and share with us is invaluable! Thanks again.
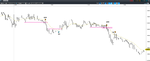
london morning session, 1m TF with pipette, EU.
Hmmm... The BB and FB look risky, but the other two look good. Looks like a good morning for you.
Hmmm... The BB and FB look risky, but the other two look good. Looks like a good morning for you.
Matt
thank you for your comment......all a matter of perception I think.......the BB the easy one in my view.....
BLS
Established member
- Messages
- 642
- Likes
- 229
Week 4 charts from Volman:
https://www.dropbox.com/sh/1amxmi9af0fk6ej/VA5_ZrjQF1
https://www.dropbox.com/sh/1amxmi9af0fk6ej/VA5_ZrjQF1
In Bob's first boom on page 45 he mentions the price scale on charting software should be in increments of 1 pip. I have setup my charts on prorealtime & my vertical axis is showing 5 digits to the right of the decimal point where I think to comply with Bob's suggestion it should just be four digits. Cant figure out how to adjust this though. Was wondering if anybody could help ?
morpheous455
Junior member
- Messages
- 11
- Likes
- 0
Anyone on this thread based in San Diego?
No but I plan on moving there in the summer... Claremont Mesa
Jim
Panjm
Newbie
- Messages
- 6
- Likes
- 3
In Bob's first boom on page 45 he mentions the price scale on charting software should be in increments of 1 pip. I have setup my charts on prorealtime & my vertical axis is showing 5 digits to the right of the decimal point where I think to comply with Bob's suggestion it should just be four digits. Cant figure out how to adjust this though. Was wondering if anybody could help ?
If you are using PRT provided by your broker , the chart will display the price in 5 digits from your broker, with no way to change to 4 digit. . But if you subscribe to PRT yourself, the chart will display 4 digit. That's what I experienced.
If you are using PRT provided by your broker , the chart will display the price in 5 digits from your broker, with no way to change to 4 digit. . But if you subscribe to PRT yourself, the chart will display 4 digit. That's what I experienced.
Thanks Panjm. Did you find the charts were visually quite different in terms of determining patterns, boundaries etc.. when you changed to the 4 digit charts ?
Panjm
Newbie
- Messages
- 6
- Likes
- 3
Thanks Panjm. Did you find the charts were visually quite different in terms of determining patterns, boundaries etc.. when you changed to the 4 digit charts ?
Yes I found there are obvious differences. You can request a trial from PRT and see for yourself. However trading this method on 70 tick chart did not work for me regardless of 4 digit or 5 digit charts.
BLS
Established member
- Messages
- 642
- Likes
- 229
Week 5 charts from Volman:
https://www.dropbox.com/sh/1amxmi9af0fk6ej/VA5_ZrjQF1
https://www.dropbox.com/sh/1amxmi9af0fk6ej/VA5_ZrjQF1
BLS
Established member
- Messages
- 642
- Likes
- 229
Week 6 charts from Volman:
https://www.dropbox.com/sh/1amxmi9af0fk6ej/VA5_ZrjQF1
https://www.dropbox.com/sh/1amxmi9af0fk6ej/VA5_ZrjQF1
Week 5 charts from Volman:
https://www.dropbox.com/sh/1amxmi9af0fk6ej/VA5_ZrjQF1[/QUOT
Could you please tell me whether Bob Volman make any 5 Min chart study on his new book available, the same as 70 ticks charts above in dropbox.com? Thanks. Jim
tintin1117
Newbie
- Messages
- 2
- Likes
- 0
Week 5 charts from Volman:
https://www.dropbox.com/sh/1amxmi9af0fk6ej/VA5_ZrjQF1[/QUOT
Could you please tell me whether Bob Volman make any 5 Min chart study on his new book available, the same as 70 ticks charts above in dropbox.com? Thanks. Jim
HE already has
TonyIommich
Member
- Messages
- 79
- Likes
- 21
It would be interesting to see Bob's 5 minute charts, but if he's posting them I don't see any in the dropbox here.
Btw, anyone else here have been trying to adapt Bob's approach to the ES? I've had some success, but it takes quite a bit of work.
One of the issues I have is when you use time based charts (I'm using the 5 minute) and display only real time trading hours with the inevitable gaps, the 21 pd EMA just becomes useless in the first two hours. At the same time I'm reluctant to display the Globex data because it stretches things out and makes it hard for me to see the levels of the past day clearly.
I've also noticed that the pullbacks on the ES are far less proportionate than the EUR/USD, with the ES you have to be really fast to catch a good pullback, and there are also more reversals in the ES. However, I've found the box break to be particularly useful when the ES is in one of those 'sideways trends'.
Bob places a lot of emphasis on adverse/favorable magnets, and my research has proven that the prior day's close is by far the most important magnet in the whole picture when it comes to stock index futures. The prior day high and low would also count, to a somewhat lesser degree, as well as the open.
I'm not sure if the magnet concept applies to round numbers so much in stock index futures, because bear in mind that futures usually trade at a discount to spot.
HE already has
Where is he posting them ? Could you please tell me the website that he posts the 5 Min chart daily?
Thanks.
cha-ching
Active member
- Messages
- 148
- Likes
- 9
It would be interesting to see Bob's 5 minute charts, but if he's posting them I don't see any in the dropbox here.
Btw, anyone else here have been trying to adapt Bob's approach to the ES? I've had some success, but it takes quite a bit of work.
One of the issues I have is when you use time based charts (I'm using the 5 minute) and display only real time trading hours with the inevitable gaps, the 21 pd EMA just becomes useless in the first two hours. At the same time I'm reluctant to display the Globex data because it stretches things out and makes it hard for me to see the levels of the past day clearly.
I've also noticed that the pullbacks on the ES are far less proportionate than the EUR/USD, with the ES you have to be really fast to catch a good pullback, and there are also more reversals in the ES. However, I've found the box break to be particularly useful when the ES is in one of those 'sideways trends'.
Bob places a lot of emphasis on adverse/favorable magnets, and my research has proven that the prior day's close is by far the most important magnet in the whole picture when it comes to stock index futures. The prior day high and low would also count, to a somewhat lesser degree, as well as the open.
I'm not sure if the magnet concept applies to round numbers so much in stock index futures, because bear in mind that futures usually trade at a discount to spot.
Thanks for the post. I actually wanted to ask you about your ES trading 🙂
I just started trading forex using Volman's low vol setting. With three pairs I still don't see too many opportunities during UK/US overlap, but definitely more than just EU. I will move to stock index futures later - now just wanna learn his price action method with forex. The information you posted is very valuable to me.
After reading Volman's second book thoroughly I am now able to see more setup potentials more quickly, and see my mistake much more quickly after I enter a trade which I should not have. Also his low vol setting kind of fits my comfort level: not too slow as 5 min, and not fast as 70 tick which I often missed an entry (at that time I was also less experienced with his price action principles). Still, it's very hard not to over-trade because entries are so scarce.
BTW do you use NinjaTrader? If so I think it has a built-in indicator to show past day's OHLC. I think Mack at PATs trading uses the same setting as Bob (also Globex data) but he just trades pullback with no regards to buildup etc. Do you follow his daily youtube videos?
cha-ching
Active member
- Messages
- 148
- Likes
- 9
I'm not sure if the magnet concept applies to round numbers so much in stock index futures, because bear in mind that futures usually trade at a discount to spot.
S&P 500 is not tradable so I'm not sure what you mean by spot. I believe S&P 500 futures (not the mini one) traders do look at big round numbers.
Similar threads
- Replies
- 15
- Views
- 9K