Traderallen
Active member
- Messages
- 248
- Likes
- 41
Ninja trader go to account connection look for option to use snapshot data. Check the box. But honestly I can trade either one it doesn't matter.
Hi there,
Hope you're having a good time traders,
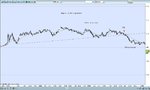
Can anybody explain why these two charts showing the same time are so different? one is from Bob's with much more bars during that period of time, another is from a demo Ninja. It seems that we can't rely on a demo Ninaja, am I right?
Different in what terms? You can put more bars on ninjatrader, just drag the time table at the bottom to your left to make the candle more compact
Idude,
I did drag the time table in a way that it matches the Bob's time, but still mine has much less bars

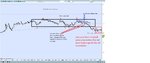
Think about a 00 level like a magnet, price gets pulled towards it when close by, and once there can often be stuck to it for a while as the bulls/ bears decide the level. Now in the first chart there is a good trade able distance +10 pips before the 00 level, and price does accelerate with the magnet effect towards the 00 level. Contrast the second chart price is right at a 00 level when the setup occurs, there is a good chance it could be stuck here a while chopping around as the level is decided. If you have the book Bob describes this in great detail.Hey guys,
I will soon have the time to practice trading. Therefore I started analyzing Bob's charts again.
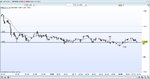
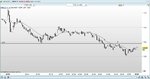
There is one trade that I don't really understand. I'd like one of you guys (especially Traderallen whose track record is very impressive) to tell me why this one was a good odds trade. If anybody else wants to chime in, I'd be glad as well !
Edit: + another chart where I don't understand why it wasn't a good move to short.
Thanks in advance.
(attached: chart 5 week 20 of 2014 and chart 5 of week 12 2014)
Think about a 00 level like a magnet, price gets pulled towards it when close by, and once there can often be stuck to it for a while as the bulls/ bears decide the level. Now in the first chart there is a good trade able distance +10 pips before the 00 level, and price does accelerate with the magnet effect towards the 00 level. Contrast the second chart price is right at a 00 level when the setup occurs, there is a good chance it could be stuck here a while chopping around as the level is decided. If you have the book Bob describes this in great detail.
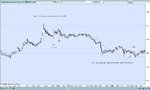
Week 36 charts from Volman:
https://www.dropbox.com/sh/1amxmi9af0fk6ej/VA5_ZrjQF1