Bob Volman Price Action Scalping

Hi everybody,
I'm in the middle of the book and pretty excited about it. The book is packed with great information from someone who actually knows what he's talking about.
Please forgive me if this has been asked before, but I don't have time to go thru all the 427 pages of this forum to figure it out (but I'm hoping to do so when I finish the book). Anyway is a simple question that won't take long for one of the experienced on this strategy to answer: As many of you, I can't afford to have NinjaTrader of Prorealtime tick charts, so I'm using an EA for MT4 which gives you 70 Ticks charts. It seems to be working pretty well specially with a broker that processes a big amount of orders. I compared Oanda and FXCM, and the charts turn out to be quite different. It becomes obvious that the feed from FXCM is way more reliable. But the those chars would be only for visually follow the PA, but never to trade with them. The ridiculously high spreads of FXCM are not even close to the 1 pip we need for our Volman's strategy. So I wonder if any of you guys have come across a different (and FREE) method to have tick charts?
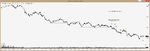
 
Be careful what you wish for, may not be what you expect.

Hi Patong, I saw your earlier post where you hit 60 pip profit, you were looking at daily time frame.
So let say on bigger time frame if you have support / resistance then probably you go to lower time frame and try to enter there. but how do you manage your entries because i think price will touch multiple time higher TF support / resistance before moving to its onward journey. so my question is if your profit target is let say 60 pip , and if you got stopped out 10 times with 6 pip loss then its lossing trade. How do you manage this :rolleyes: One way is to increase you position size..
 
Today's Trade

Well, I tried to post something yesterday but it's caught up with the moderator or something because I'm a new member. We'll see if this one goes through.

Here's a chart from today I have a question about for some of you. There was a pending news break (US Non-Manufacturing PMI at 07:00 on the chart) which prompted me to skip two valid trades. I then took the third trade which ultimately reached goal after a pullback behind the signal line. Two questions...

1) My original stop on the trade taken was placed at the bottom of the ARB block above. My reasoning--if I had entered on the ARB trade then that is still where my stop would have been as it was clearly the strongest resistance around. When trading from a flat base (like BB), I often leave the stop at the signal line of the trade rather than a weak pullback low below it. However, if the trade had been stopped out this would have cost me an extra 4 pips compared to the next possible tipping point below (which I judged to be took weak to use). If I had either exited more aggressively or passed on the trade, I still could have entered on the next BB a few minutes later. So, although this worked out for me today, what would you guys have done based on your chart observations? Would you have passed this trade up because of the awkwardly large stop? or Would you have had a more aggressive tipping point? Or would you have done it the same that I did?

2) Secondly, I'm still learning which news breaks to ignore or be wary of (I've only been trading a few months). Forex Factory rates the Non-Manufacturing PMI which took place this morning as "high impact", but I can't remember it causing much wake in the charts the past couple of months. Should I not have been worried about the PMI this morning? Which news breaks do you guys avoid taking trades prior to?

Any thoughts are much appreciated?
 

Attachments

  • 2014.08.05_1.png
    2014.08.05_1.png
    34.9 KB · Views: 205
  • 2014.08.05_1b.png
    2014.08.05_1b.png
    45.4 KB · Views: 271
  • Chart Markings.PNG
    Chart Markings.PNG
    9.3 KB · Views: 163
Hi Patong, I saw your earlier post where you hit 60 pip profit, you were looking at daily time frame.
So let say on bigger time frame if you have support / resistance then probably you go to lower time frame and try to enter there. but how do you manage your entries because i think price will touch multiple time higher TF support / resistance before moving to its onward journey. so my question is if your profit target is let say 60 pip , and if you got stopped out 10 times with 6 pip loss then its lossing trade. How do you manage this :rolleyes: One way is to increase you position size..

You manage your entry when price is at the higher TF support, this enables you to have a smaller stop at a significant s/r zone. The longer timeframe S/R is more relevant and stronger than shorter timeframe. But the number or zone remains the same no matter which period chart you trade.

Using BVs method I like to know where any hidden s/r numbers lay on higher period time charts.
 
Well, I tried to post something yesterday but it's caught up with the moderator or something because I'm a new member. We'll see if this one goes through.

Here's a chart from today I have a question about for some of you. There was a pending news break (US Non-Manufacturing PMI at 07:00 on the chart) which prompted me to skip two valid trades. I then took the third trade which ultimately reached goal after a pullback behind the signal line. Two questions...

1) My original stop on the trade taken was placed at the bottom of the ARB block above. My reasoning--if I had entered on the ARB trade then that is still where my stop would have been as it was clearly the strongest resistance around. When trading from a flat base (like BB), I often leave the stop at the signal line of the trade rather than a weak pullback low below it. However, if the trade had been stopped out this would have cost me an extra 4 pips compared to the next possible tipping point below (which I judged to be took weak to use). If I had either exited more aggressively or passed on the trade, I still could have entered on the next BB a few minutes later. So, although this worked out for me today, what would you guys have done based on your chart observations? Would you have passed this trade up because of the awkwardly large stop? or Would you have had a more aggressive tipping point? Or would you have done it the same that I did?

2) Secondly, I'm still learning which news breaks to ignore or be wary of (I've only been trading a few months). Forex Factory rates the Non-Manufacturing PMI which took place this morning as "high impact", but I can't remember it causing much wake in the charts the past couple of months. Should I not have been worried about the PMI this morning? Which news breaks do you guys avoid taking trades prior to?

Any thoughts are much appreciated?

is there any reason your charts are 60 tick and not 70 tick? BV prefers 70 tick.
 
is there any reason your charts are 60 tick and not 70 tick? BV prefers 70 tick.

I've been trying match Bob's charts on my data service. Since I already had a lot of hours invested in studying charts on Kinetick's data service before being introduced to Bob's method I decided to stick with that (at least for now), but I noticed some differences between Kinetick and ProRealTime when I began to study Bob's charts. Bob's 70 tick chart prints more bars than my 70 tick especially during the London session for some reason, but mine prints more during news releases especially after the US open. I've tried anywhere from 60 to 90 tick settings and am currently trying 60. So far it seems pretty close during London hours.
 
I've been trying match Bob's charts on my data service. Since I already had a lot of hours invested in studying charts on Kinetick's data service before being introduced to Bob's method I decided to stick with that (at least for now), but I noticed some differences between Kinetick and ProRealTime when I began to study Bob's charts. Bob's 70 tick chart prints more bars than my 70 tick especially during the London session for some reason, but mine prints more during news releases especially after the US open. I've tried anywhere from 60 to 90 tick settings and am currently trying 60. So far it seems pretty close during London hours.

Excellent Matt, looks like you have done your research. I don't think 10 ticks either way is going to make much difference in the end.
 
Matt Chao, The attached chart is my re-creation of your chart. I did this so you can see what I see compared to what you are looking at. It's not perfect but I think it's close enough you get the picture.
$EURUSD (70 Tick)  8_5_2014  STUDY.jpg
To answer your first question I would've left a 10 pips stop in place just as I have marked on the chart.
To answer your second question. Using whatever calendar you like you should make note of every major news release. In the case of Forex factory all those that are marked red you should be aware of. As an aspiring trader you should never hold a scalp trade into a news trade.
I've included a link to a video that I made today that shows the trade that I took at this same time. Allen
http://youtu.be/akKlilaYGmA
 
So I wonder if any of you guys have come across a different (and FREE) method to have tick charts?

Those who keep asking about free tick charts/ platform, just google ninjatrader demo, there is plenty who provide. As you have being using FXCM, here is their free ninja demo,
http://www.fxcm.com/products/ninjatrader/free-software/

Scroll to the bottom of the page to find demo sign up, not sure how long it last but just sign up again for another one.

Just remember to change the setting in tools - options - data - quote currencies FX = Pip
 
EUR USD trade 6 aug 14

I just took this trade right now, I dont know its BV trade or not, but the reasoning behind this was that trend was down and formed a range in down trend, i took the rang break, of 60.
Only thing i regret is i got out too early :( and did not kept my 10 pip target. i made around 4 pips. I should have waited and moved my stops to another peak at 60 which got created after break of 60.
time in the chart is not correct. I have to set it up, but i dont know how because its coming from script. This trade is around 5:47 EST

As some have questions about 70 tick chart, I am using OANDA Meta trader, and there is a script i downloaded , which i have highlighted on left side of image. I am just setting the value to 70
Experts please comment.
 

Attachments

  • eurusd6Aug14.GIF
    eurusd6Aug14.GIF
    79.2 KB · Views: 262
Last edited:
I don't think 10 ticks either way is going to make much difference in the end.

Patong -- Good point. I tend to obsess a little too much about details sometimes :). Thanks for the reply.

Allen -- Thanks for taking time to mark-up the chart. It's helpful to see the same period on a different 70-tick chart.

I've noticed that you typically leave your stops at 10 pips (all of your losses on the trades you've shared seem to be 10 pips). Do you track how often the 10 pip stop pays off for you? I mean how often your profitable trades would have been stopped out prematurely with a traditional tipping point? Would be interesting to track.

I've also noticed that you keep track of order flow in your time & sales window. How helpful is that? I haven't tried it.
 
I just took this trade right now...

Here's a snapshot of my chart for the same period. I slept in a bit this morning and missed that one, but marked it on the chart. Not sure if your chart is tick or time. It looks much slower than Bob's chart. The 70-tick typically shows a clearer signal line and helps you avoid teases in situations like this. The exact entry is hard to see on your chart. I would not have been able to tell if it was a valid trade.

Once you study the book, you'll be able to refine your exit strategy. Volman's strategy is to stay in until the "tipping point" is taken out. Occasionally, he'll exit near target if the price hesitates at a round number level (like the 50 level in this case), but there wasn't much problem there on this trade. Better that you read about it than that I explain further.
 

Attachments

  • Capture.PNG
    Capture.PNG
    37.7 KB · Views: 186
Here's a snapshot of my chart for the same period. I slept in a bit this morning and missed that one, but marked it on the chart. Not sure if your chart is tick or time. It looks much slower than Bob's chart. The 70-tick typically shows a clearer signal line and helps you avoid teases in situations like this. The exact entry is hard to see on your chart. I would not have been able to tell if it was a valid trade.

Once you study the book, you'll be able to refine your exit strategy. Volman's strategy is to stay in until the "tipping point" is taken out. Occasionally, he'll exit near target if the price hesitates at a round number level (like the 50 level in this case), but there wasn't much problem there on this trade. Better that you read about it than that I explain further.

Thanks Matt, I woke up around 5 today, otherwise i should have got the first trade too on your charts.Will try to wake up at 4 am london open.

Your charts are clearly better then mine. I need to fix my tick chart or buy through some provider.
I know you are using prorealtime for charts, so do you mind telling me who is your broker. and do you do forex spot or futures. I asked oanda but they dont have tick chart yet in there platform.
 
Last edited:
I know you are using prorealtime for charts, so do you mind telling me who is your broker. and do you do forex spot or futures. I asked oanda but they dont have tick chart yet in there platform.

Actually, I use Kineticks's data service for NinjaTrader simply because my broker (Oanda) does not provide tick data like you said. NinjaTrader charting software is free but I pay for the data service. In the future I'll probably switch brokers and perhaps take advantage of a free broker-provided feed although I suspect that the broker feeds may not be as high quality. I've considered ProRealTime. If I had found Volman's book sooner, I would have gone with them, and may still switch in the future.

It sound like you're looking for free tick data. There are brokers out there who provide tick data to account holders. You'll just have to do some research. This link may give you a place to start.

I trade spot forex.
 
hey guys;
2 questions:
1-does anyone uses the regular charts(5min-15 min charts)with this strategy?
2-can you introduce some forex tick chart brokers for free?
Best regards

1 - Can you use Volman's strategy on any TF or Chart I guess you could but one of the reasons to use tick charts is to get in earlier. I myself don't like time charts and try to not even look at them, personally I use constant bars and I did develop my strategy around one of the Volman's startegies even though I'm not using tick charts.

2 - It's more of a charting software question than a broker's question. I think one one of the reason he tells you to use a 3rd party charting service and not your brokers is because of the tick feed which is very important, plus very important to use 4 digits instead of 5 digits, if you use ninjatrader you can set it up to eliminate the 5th digit in settings.
 
Thank you for " Week 33 Report ", Bob Volman and BLS.

The market last week was very tough for me.
My problem in this method is almost my mental.
I must more concentrate my attention on what 70 tick charts show the price action for hours and hours. It's my big task. But I feel it's difficult for me a little.:(
 
Hi there,
Hope you're having a good time traders,
Can anybody explain why these two charts showing the same time are so different? one is from Bob's with much more bars during that period of time, another is from a demo Ninja. It seems that we can't rely on a demo Ninaja, am I right?
 

Attachments

  • 1.jpg
    1.jpg
    85.8 KB · Views: 237
  • $EURUSD (70 Tick)  8_11_2014.jpg
    $EURUSD (70 Tick) 8_11_2014.jpg
    80.7 KB · Views: 259
Top