Traderallen
Active member
- Messages
- 248
- Likes
- 41
Trading is not easy but sometimes we make it harder than it needs to be. Probably the hardest aspect of learning how to trade is there is no good formal education that can really prepare you for being a do it yourself trader. There is so much misinformation out there that I would say you are lucky if you started out learning this method first. I have studied hundreds of methods from all the gurus and most of them are meager at best. The problem is you want to believe they know what they're talking about so you spend the time and money to learn every aspect of their trading methodology only to find out that it's all but worthless. I'm a firm believer that a trading method has to have an entry method, a stoploss method, a profit target method, and a money management method to be successful. This price action scalping method that Bob Volman teaches in his book has all of them.
With his method we can see the trees however we don't want overlook the forest. We are still scalping on a short-term timeframe so that means we need to be proficient at reading order flow. When you're watching the chart don't think of them as candles are bars think of them as buyers and sellers and both are battling to get the best price. try to keep that mental picture in your head of who's winning and who's losing.
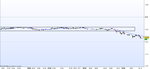
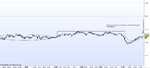
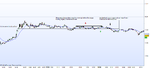
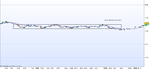
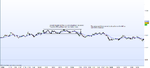
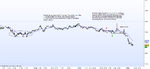
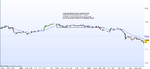
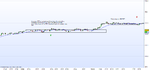
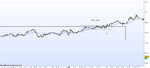
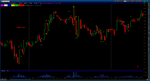
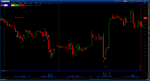
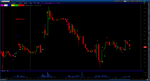
When I'm watching the price chart and I see a range forming the first thing I do is put a block around it and I extend the block past the candles to the right side of the chart. Now watch for a range break to form the closer it gets to the top of the box the more I get prepared to pull the trigger. I also keep an eye on my level II screen as the bar break out of the box I'm watching the speed of my level II and asking myself the question are there new orders coming in? If I see a bullish breakout bar and I can see order flow coming in I'm quite confident that my range break trade is going to reach the target. Picking out head and shoulders patterns can be quite subjective at times. Try putting a box around the ranges like Mr. Volman and I do. Extend the box to the right so the price has to fill the box. The chart above is not the best example but if you look at my green arrow where I entered you can see the box extends well past my entry to the right. Doing this makes it very easy to watch the price action as it bounces along inside the box and also helps to pick out advance range breaks when it pops up for a tease and then comes back into the box.
One last thing about paper trading I'm not very fond of it it lures into a false hope or sense of security because you're emotions are not a play. With Forex is very easy to open a micro account we can at least get started trading with real money and not risk losing a lot. When you have nothing on the line it's too easy to get relaxed and/or lazy when you're watching the charts. When you have money on the line even though with the micro accounts it's just a few pennies it still helps you to stay focused on the chart. And you learn Bob's method of money management as you go along.
With his method we can see the trees however we don't want overlook the forest. We are still scalping on a short-term timeframe so that means we need to be proficient at reading order flow. When you're watching the chart don't think of them as candles are bars think of them as buyers and sellers and both are battling to get the best price. try to keep that mental picture in your head of who's winning and who's losing.
When I'm watching the price chart and I see a range forming the first thing I do is put a block around it and I extend the block past the candles to the right side of the chart. Now watch for a range break to form the closer it gets to the top of the box the more I get prepared to pull the trigger. I also keep an eye on my level II screen as the bar break out of the box I'm watching the speed of my level II and asking myself the question are there new orders coming in? If I see a bullish breakout bar and I can see order flow coming in I'm quite confident that my range break trade is going to reach the target. Picking out head and shoulders patterns can be quite subjective at times. Try putting a box around the ranges like Mr. Volman and I do. Extend the box to the right so the price has to fill the box. The chart above is not the best example but if you look at my green arrow where I entered you can see the box extends well past my entry to the right. Doing this makes it very easy to watch the price action as it bounces along inside the box and also helps to pick out advance range breaks when it pops up for a tease and then comes back into the box.
One last thing about paper trading I'm not very fond of it it lures into a false hope or sense of security because you're emotions are not a play. With Forex is very easy to open a micro account we can at least get started trading with real money and not risk losing a lot. When you have nothing on the line it's too easy to get relaxed and/or lazy when you're watching the charts. When you have money on the line even though with the micro accounts it's just a few pennies it still helps you to stay focused on the chart. And you learn Bob's method of money management as you go along.