Bob Volman Price Action Scalping

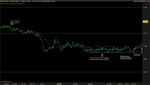
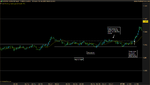
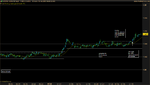
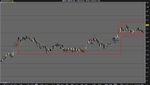
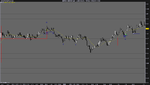
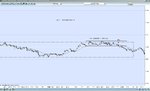
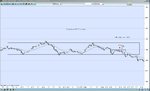
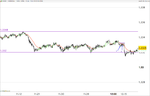
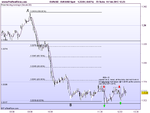
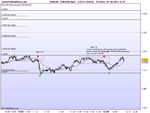
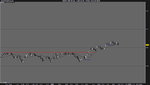
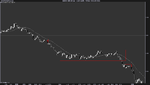
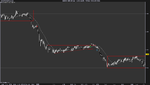
Here's my trades today.

Pretty nimble of you to take advantage of today's price action like that. I on the other hand seemed to be falling asleep at the wheel and had to give up on some possible trades because price action just seemed too fast for me.
 

Attachments

  • Untitled picture.png
    Untitled picture.png
    24.8 KB · Views: 203
  • Untitled picture1.png
    Untitled picture1.png
    23.6 KB · Views: 202
  • Untitled picture2.png
    Untitled picture2.png
    23.6 KB · Views: 172
I hope charts look fine now. here some trades from London session:
 

Attachments

  • DD-RB.png
    DD-RB.png
    21.8 KB · Views: 198
  • RB-DD.png
    RB-DD.png
    21 KB · Views: 204
Last edited:
Nice retrace to the 60% level and a text book BB, now waiting for a rang brake to the long side I'm a bit reluctant to take a short RB.
 

Attachments

  • USD Spot.png13feb.png
    USD Spot.png13feb.png
    10.3 KB · Views: 178
Thanks Bls & virtuesoft
Yesterdays trades made up for the 30 pip loss from Monday, just one trade today not ideal to say the least i.e a lack of good pressure.
 

Attachments

  • USD Spot.png13feb2.png
    USD Spot.png13feb2.png
    8.9 KB · Views: 183
Took one trade today (had classes all day)

Seemed like a nice RB, there was some choppy price action inside of it but it was way before the break. The break didn't generate any follow through. I just exited after a while because of the stalling.

Edit: in hindsight, this pattern doesn't look good at all.

Question: do lunch hours (I guess from noon to 2 pm london time) affect the volatility of the market?

Unrelated question: Bob talks about the "cup and handle" pattern in the book, however on his latest charts he talkes about M and W patterns inside a range/block formation (these W start out big in a range and then get smaller and smaller as we approach the break). It seems to me like it's the same thing. Am I right ?
 

Attachments

  • Wednesday 1.png
    Wednesday 1.png
    25.8 KB · Views: 172
Last edited:
Question: do lunch hours (I guess from noon to 2 pm london time) affect the volatility of the market?

I think they do but nothing is set in stone. If you see slower/thinner price action around that time then maybe be more cautious in choosing your trades.

Unrelated question: Bob talks about the "cup and handle" pattern in the book, however on his latest charts he talkes about M and W patterns inside a range/block formation (these W start out big in a range and then get smaller and smaller as we approach the break). It seems to me like it's the same thing. Am I right ?

You can think of the cup and handle as part of the bigger Ww pattern but I think (I haven't reread the book in awhile) the cup and handle refers more to the price action closer to the breakout. Bob is trying his best to teach us to read price action and trying to speed up the learning curve when he introduces patterns like Ww in his weekly chart (those that weren't explicitly mentioned in the book).
 
I hope charts look fine now. here some trades from London session:

Hi LoSparviero
Regarding the IRB on the first chart its usually better to have the 20EMA helping price out, would probably have been better to extend the box to the right where the EMA started to turn down.

I would have felt much happier taking the first IRB at the bottom of the range where the EMA lifted price up, iv included a couple of bobs charts for example.
 

Attachments

  • 1.jpg
    1.jpg
    94.3 KB · Views: 205
  • 4.jpg
    4.jpg
    95.5 KB · Views: 190
Hey guys,
sorry I havent posted this week, I'm trying to finish ARB chapter, but not just reading it but studying it.
I spoted this IRB this morning b4 it broke but I wasnt sure about the signal bar.
Im curious to hear which is for u the proper signal bar, the one signaled by arrow 2 or the one signaled by arrow 1. I missed the trade because of this confusion.
Im going to read older posts in the meantime
thx,
 

Attachments

  • USD Spot.png
    USD Spot.png
    33 KB · Views: 226
At some point i feel there will be a 50-60% retrace and this range could be it.
Two trades so far today.
 

Attachments

  • USD Spot.png14feb.png
    USD Spot.png14feb.png
    14.4 KB · Views: 211
  • USD Spot.png.14febt1.png
    USD Spot.png.14febt1.png
    11.3 KB · Views: 220
At some point i feel there will be a 50-60% retrace and this range could be it.
Two trades so far today.

Nice trades !

To the left of the first trade there was some extremely choppy action on my chart (probably Prorealtime bug that we've been seeing lately). But it still looked very tempting, I probably would've taken it.

Just took the range you were talking about. It didn't really break for some reason. Will post charts later.
 
Thx Yorkshire for your suggestion.

Here some trades from today, the first chart is one of the skipped examples on Volman's book but I took it because of the two doji after the break, I thought that the break of those doji was enough to consider the momentum built up. Watching this chart now I think I did a bit gambler entry :cheesy:
Anyway, what about the second chart, i missed these trades that were good for me, what do u think about?
The third chart is a stop. I have a question about this. This is a BB or a RB? I think this is a BB and I made a mistake trading the BB countertrend...looknig at the chart is now clear that was probably a consolidation before a resume of the downtrend.....I've to learn a lot :)
In your opinion there are situation where taking a BB countertrend is a right choice?
 

Attachments

  • BB1.png
    BB1.png
    15 KB · Views: 233
  • missed.png
    missed.png
    17 KB · Views: 203
  • BBskip.png
    BBskip.png
    19.4 KB · Views: 216
At some point i feel there will be a 50-60% retrace and this range could be it.
Two trades so far today.

Hey Yorkshire,
I realized the trade u took is the same I spotted on the chart and I basically did the fibo analysis u did, but when zooming on the setup, u will see there were 2 lows to break, and because the road to the bottom was giving only 8 pip, so I did hesitate about the signal bar to break. which of the 2 level of break did u choose when u traded it?
from hindsight, both would have hit the target, but the one proper to break according to the method is??
 
Nice trades !

To the left of the first trade there was some extremely choppy action on my chart (probably Prorealtime bug that we've been seeing lately). But it still looked very tempting, I probably would've taken it.

Just took the range you were talking about. It didn't really break for some reason. Will post charts later.

When i mentioned about a possible retrace i was not implying that i would be looking to trade it, that would be a counter trend trade and the momentum was defiantly down.
What i would tend to do is look for a block brake around the 50-60% area, i pretty sure iv read it somewhere in bob's notes.

Another scenario could be that price would continue down (trend equals trend).
 
Top