Bob Volman Price Action Scalping

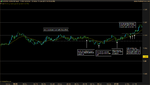
I know Bob Volman trades spot forex, but I trade futures.

Since spot is different by the amount of forward points, I add the 00, 20, and 50 lines from spot forex on my chart.

So the purple lines on the chart are what the corresponding price would be on the spot market ( adding the forward points ).

Do anyone else do something like this ?

I trade futures as well, but don't do this. My main objection to this is the added chart clutter. To me it would seem to get too distracting having all those extra lines on the chart. I do have FreeStockCharts going on another computer that I can glance at quickly if I am worried about a level being in play, but usually don't check it that much unless the 00 level is in play.

Generally I don't pay too much attention to the numbered price levels, and worry more about actual S/R levels that price has tested in the past. To me the numbered levels just adds another layer of complexity. Not that I've been wildly successful with this method yet, and I could be totally out to lunch, but I just prefer to concentrate on finding good looking setups,

I do see your point on cluttering the chart, but I don't see the actual lines ( light grey lines ) on the chart anymore. I do look for S/R levels, mainly the 00 and 50 levels.

I do like having them since they do seem to be a little more in tune with the spot market, that is it feels more like spot.

I trade on a single 15" screen and I don't want to have to switch back and forth between another program to see or levels, or constantly subtract forward points in my head all day to see if the market is bouncing off a 50 or 00 level..
 
Today was my first day back after the holidays. There was a bit of movement but I didn't spot any good setups so I stayed on the sidelines. Did anyone else trade?

Virtuesoft, I know youtrade a few pairs; I am interested to know whether you have different targets/ stop sizes for each?

I don't trade exactly Volman's methods and am experimenting with different stop sizes (but still fixed risk) based on the average candle size over the last 60 candles.

This helps me lower my position size/ increase my stop loss in times of high volatility or for higher volatility pairs (EUR-JPY) or increase my position size/ decrease my stop loss for times of lower volatility or for lower volatility pairs (AUD-USD).

I don't use fixed targets but the same idea could be applied to Take Profit levels. Should hopefully smooth profits amongst different pairs/ volatility periods.

Just an idea...

M
 
No trades for me today but there was one potential setup. I thought the price action leading up to it was quite interesting but I decided to pass on it because I felt the entries were premature. I think it looks really good in hindsight though. I kept thinking I should wait for proper build up because price action was stuck between the 20 and the 40 for a couple of hours but you can see that the a lot of the bars are 3+ pip long which probably means there's quite a bit of trading going on.
 

Attachments

  • USD Spot.png
    USD Spot.png
    31.9 KB · Views: 245
Virtuesoft, I know youtrade a few pairs; I am interested to know whether you have different targets/ stop sizes for each?

I don't trade exactly Volman's methods and am experimenting with different stop sizes (but still fixed risk) based on the average candle size over the last 60 candles.

This helps me lower my position size/ increase my stop loss in times of high volatility or for higher volatility pairs (EUR-JPY) or increase my position size/ decrease my stop loss for times of lower volatility or for lower volatility pairs (AUD-USD).

I don't use fixed targets but the same idea could be applied to Take Profit levels. Should hopefully smooth profits amongst different pairs/ volatility periods.

Just an idea...

M

Hi Mark,

Sorry for the delay in replying. I've got a winter bug so I'm not trading at the moment.

I use the same target and stop for all three pairs that I trade. I just alter the position size for each pair I trade. Your approach is interesting. I will have a look at it in more detail tomorrow.
 
Last edited:
Have just started really getting into this book and it is by far and away the best of anything I have read. Really appreciate this thread and once I am a little more comfortable with the entries I will definitely get involved.

Andy

Edit - question to BLR or any of the other experienced guy with Bob's strategies. What do you think about taking one of the set ups and just focusing on that to really master it before moving on (perhaps using it across one or two of the other major crosses as well)?

I would focus on the RB/ARB setups. Bob has pretty much said that he prefers the IRB for now but the IRB setups are harder to spot. The current environment isn't quite favorable for the FB/SB/DD (though a good one pops up once in awhile). You are welcome to experiment with other major pairs but I think focusing on one pair for now may be more productive.
 
I would focus on the RB/ARB setups. Bob has pretty much said that he prefers the IRB for now but the IRB setups are harder to spot. The current environment isn't quite favorable for the FB/SB/DD (though a good one pops up once in awhile). You are welcome to experiment with other major pairs but I think focusing on one pair for now may be more productive.

Cheers mate, it was those exact two that I am going to focus on anyway. For some reason I just find them very logical and am naturally more comfortable with them.

Thanks for the reply and im looking forwards to contributing
 
Hello fellow traders who study Bob's method, I want to introduce myself to the thread. Creating it and sharing the charts is a great idea.
I have been studying the method in depth for 6 months, tho so far I have been focused on the trend chapters, I recently started to study the ranges.
Looking forward to share opinions in the future, when I get more knowledge of the ranges.

Good thread BLS and Price action scalpers.: thumbsup:
,
ptsnu
 
Volman traders are pretty quiet, how you all getting along?

M

I did not take a single trade last week. I'm still having trouble finding the IRBs since I tend to focus on the range barriers more. Did not take a trade today either. I missed that free fall and bounce up on the Euro since I don't trade the first half of the London session. Weird day for the tick chart. I kept seeing sudden bursts of activity with price not really moving anywhere (sometimes there were bars printing in less than a second) which kind of muddled the overall picture for me.
 
I did not take a single trade last week. I'm still having trouble finding the IRBs since I tend to focus on the range barriers more. Did not take a trade today either. I missed that free fall and bounce up on the Euro since I don't trade the first half of the London session. Weird day for the tick chart. I kept seeing sudden bursts of activity with price not really moving anywhere (sometimes there were bars printing in less than a second) which kind of muddled the overall picture for me.

I agree BLS. Found the prorealtime data was way out from 2 different brokerage feeds often. Was really strange - never seen anything like it. However, when I questioned prorealtime about it they said nothing was wrong.

Regrading the quietness of this thread - I wish I had the time to contribute more, but I make a point of only focusing on the markets while I'm trading and I usually go straight to bed afterwards as it is late and I have a full time job during the day.

However, I read all the posts when I have a moment and find Bob's charts extremely helpful.
 
Hello,
I also usually trade ony from 9:30 am London time (4:30 am on my local time), but for some reason I did wake up today earlier, and let me tell you, from my point of view today was a great day for Bobs method. I was able to take 3 trades for full 10 pip. I will post a picture with todays first trades I managed to spot, some comments are in spanish, but the labels for the trades I was able to spot are all labeled the way they are called in the book.
Please feel free to comment about the setups in the picture, If u think they are wrong , Im all about learning, and talking about this method I love. If having some texts in spanish is an issue, let me know and I will remove the pic from the post, I usually try to think mostly in english but today the market moved so fast my mind could keep up the pace of trading and translating at the same time in my mind.

Thx,
ptsnu
 

Attachments

  • USD Spot1.jpg
    USD Spot1.jpg
    718.8 KB · Views: 1,791
Weird day for the tick chart. I kept seeing sudden bursts of activity with price not really moving anywhere (sometimes there were bars printing in less than a second) which kind of muddled the overall picture for me.

The ECOFIN meeting in Brussels had all sorts of nonsense going on - rumours, doorstop interviews and God knows what else where European politicians are concerned. Forex Factory had liquidity at 300 pc above the average of the last couple of weeks at times yesterday. All totally untradable for scalping I agree, and there may be more for the rest of the week with various self-important clowns floating round Davos saying the first thing that comes into their heads. Bob refers to these unscheduled news events on pages 165 and 166 of his book, basic message being to step aside for a while (I went and watched a couple of episodes of "The Sopranos" on DVD).

Jeremy
 
I did not take a single trade last week. I'm still having trouble finding the IRBs since I tend to focus on the range barriers more. Did not take a trade today either. I missed that free fall and bounce up on the Euro since I don't trade the first half of the London session. Weird day for the tick chart. I kept seeing sudden bursts of activity with price not really moving anywhere (sometimes there were bars printing in less than a second) which kind of muddled the overall picture for me.

BLS (and others)

Do you have any methods for keeping concentration when you are out of the market for so long?

What session hours are you trading?

M
 
The ECOFIN meeting in Brussels had all sorts of nonsense going on - rumours, doorstop interviews and God knows what else where European politicians are concerned. Forex Factory had liquidity at 300 pc above the average of the last couple of weeks at times yesterday. All totally untradable for scalping I agree, and there may be more for the rest of the week with various self-important clowns floating round Davos saying the first thing that comes into their heads. Bob refers to these unscheduled news events on pages 165 and 166 of his book, basic message being to step aside for a while (I went and watched a couple of episodes of "The Sopranos" on DVD).

Jeremy

Thanks for the info Jeremy. I did not realize that FF had a tool for measuring liquidity.

BLS (and others)

Do you have any methods for keeping concentration when you are out of the market for so long?

What session hours are you trading?

M

I take small breaks from time to time be standing up, stretching, and moving my legs a bit. I still keep an eye on the chart but I have to get my blood going every now and then or I get drowsy (I used to doze off during my longer classes in high school because I never got the chance to stand up and walk around :LOL:)

I try my best to stay focused during the ranging action by practicing my range barrier drawing skills. I play around with the lines a bit to try to get a clearer picture.

When price action gets slow I go back and study Volman's charts, maybe 1-2 at a time before focusing my attention back on the chart again.

I usually trade the first half of the NY session (13-17 GMT). I hate trading the second half because I have a habit of getting in right before activity dries up, which usually leaves my stuck in a trade going nowhere for awhile. If the price action is faster than the usual doldrums then I'll sit through the second half until things slow down.
 
Hope everyone is doing well. I was curious how many people are still trying to stick to exactly Bob's method versus developing their own.

I personally realized that the 70tick/30 second chart was simply too much information for me and I was having a hard time stopping myself from getting too smart and overtrading. I find that I do better with the five minute chart, sorta like Al Brooks. It gives me a larger technical picture to work with and I've learned that a candle in itself can give you a lot of information.

I must say that I've found Bob's book probably the best, hands down, in terms of communicating what its like to trade a real strategy, and his insights on micro-level technical analysis really helped me see the market better. Even those who don't like his method can learn a lot from reading about it.
 
Hi Guys: I just got referred to this site after reading FPAS for the first time. I was very pleased to find Bob's methods appear to fit with other price action trading I've been studying, which covers day trading methods but not specifically scalping. Now I've read FPAS once I need to make my own condensed notes on the methods during a second reading.

Does anyone have a set of digital images of the charts in FPAS please? I think Bob's extended chart commentaries are excellent, but I find turning back a couple of pages to the chart is a little distracting at times.

Thanks, Max
 
Top