Bob Volman Price Action Scalping

Very good results virtuesoft. May I ask how many hours do you trade per day, and how many trades you take (on average) per week? Are you comfortable with all 7 setups or just some of them? Thanks.

I'm taking about 3 trades per week. I'm very picky with my trades and I miss lots of setups because of this.

I trade for about 9 hours a day. I wake up at 07:00 and I switch my computer on straight away. I usually go for a jog or a workout at about 11:00 for an hour. I have lunch at about 12:30 but it's always at my desk. I stop trading at about 17:30. At about 20:00, I spend a bit more time reviewing any trades that I have taken, any that I've missed, and generally how the day went. I keep a log of each trade and a diary for each day.

At the weekend I spend about 2 hours reviewing the past weeks trading.

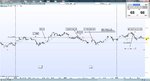
I'm not very comfortable with the IRB setup. I do trade it as a barrier bounce setup but I've never traded one when it's formed in the middle of a range or in anticipation of a breakout like Bob does.

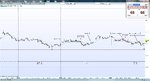
I also only trade ARB's when the price pulls back after a breakout. I don't trade them when the price stalls in a narrow block just above or below the range barrier.

All the other setups I'm fairly comfortable with. Statistically, the setups with the highest success rate in my case are...
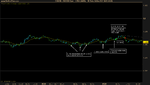
Block Break - 69%
Double Doji - 67%
Range Break - 62%

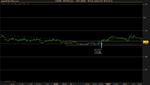
In terms of net pips I've made the most with the Double Doji setup. This is because the stops are usually really tight so the losses are nearly always smaller than a typical Block Break or Range Break setup.
 
Anyone can critique the way I handled this ?

I think you entered on a tease break. The real break came 2 bars after your exit.

An aggressive entry would have been when the H&S break failure. That is where you see the doji, then the small-bodied bar with the long lower tail, then another doji. Dojis had equal highs so you could have aggressively taken as an IRB after the failure to the lowside.
 
@virtuesoft
Amazing discipline! How do you keep yourself from getting bored?
Or what do you do when bored?
 
@virtuesoft
Amazing discipline! How do you keep yourself from getting bored?
Or what do you do when bored?

I'm really not that disciplined. I get distracted and I surf the internet far too much. When it's quiet I try to keep busy by reading, researching and working on my trading plan. I have to force myself to do this because it's far easier to be lazy. I have uninstalled all the games from my PC and I've blocked certain time wasting websites during the day.
 
Thanks for the responses - what I meant was that some of the trades marked up on the charts that were skipped were near identical in behaviour to trades that were taken later, the latter only developed into winners given time, time which wasn't given to the skipped trades, but no satisfactory explanation was given as to why the skipped weren't entered and allowed to develop (in my mind). I could be mistaken, perhaps I should read the annotated versions more closely.
It's very dependent on the overall picture. An otherwise good setup may be skipped because of visible chart resistance or unfavorable conditions. You have to exercise a lot of discretion and not just rely on the setup itself. I think the biggest challenge to trading this method is trying to exercise the same level of discretion in picking trades as Volman does. Volman tries very hard to put it into words but I feel that he's unable to put it all into words. There is something missing from his book (at least for me anyway) as he's been trying his best to fill that gap with the weekly charts he provides us. I don't fault him for this. I think there is a certain level of intuition for picking trades that one can only pick up from countless hours of studying the charts.

I myself have not been profitable since I started trading this method. Trading this method has been my first experience with a live market so I still have a lot to learn about trading in general.

One trade for me today. Not best setup in hindsight but I thought it was worth a shot to aim for the 80 level at the time. You can kind of see a Ww pattern inside.
 

Attachments

  • Untitled picture.png
    Untitled picture.png
    14.4 KB · Views: 192
  • Untitled picture1.png
    Untitled picture1.png
    11.1 KB · Views: 184
@BLS, your first chart looked good to me and I didn't like the 2nd chart. But it was the exact opposite that actually worked. Hmmmm. Some studying to do.
 
@BLS, your first chart looked good to me and I didn't like the 2nd chart. But it was the exact opposite that actually worked. Hmmmm. Some studying to do.

The second one would not have made the 10 pip target before triggering a trailed stop. I wasn't convinced at the time that the bears were done with the 60 level. I didn't like the entry either. Oh well, something to take note of I guess.
 
One trade for me today. Not best setup in hindsight but I thought it was worth a shot to aim for the 80 level at the time. You can kind of see a Ww pattern inside.

I took that RB too but got distraction and ended up bad. Also spotted two IRB/BB and took one of them. This was the first IRB/BB setup I have ever taken, please feel free to comment. A couple of questions:

1) In M1: the bottom barrier was 4 pips lower than the 50% level, which itself was about 36%. Do you think that was a concern? (I missed this entry due to a bathroom break. I'm considering a new setup like the picture attached below :D )

2) In E1: when price crossed 20ema for the first time (the white candle) I found that I was facing the situation that the next bar may take the high of the white candle without taking the low of it first. In that case would you exit? In the book there are several examples when a swing high/low formed, one needs to wait for the opposite side of that swing high/low bar taken out first before tipping point is moved. In this trade four more candles followed with equal lows which formed a cluster. I should've exited at the fourth bar after the candle but I hesitated. It ended up with a small profit as opposed to a loss but I want to make sure I do the right thing.
 

Attachments

  • 20121126a.jpg
    20121126a.jpg
    304.5 KB · Views: 223
  • 20121126b.jpg
    20121126b.jpg
    326.9 KB · Views: 207
  • computer-toilet.jpg
    computer-toilet.jpg
    78.4 KB · Views: 171
@BLS, your first chart looked good to me and I didn't like the 2nd chart. But it was the exact opposite that actually worked. Hmmmm. Some studying to do.

For the first chart my question is with the double top to the left, is it valid to draw a range like that?
 
I took that RB too but got distraction and ended up bad. Also spotted two IRB/BB and took one of them. This was the first IRB/BB setup I have ever taken, please feel free to comment. A couple of questions:

1) In M1: the bottom barrier was 4 pips lower than the 50% level, which itself was about 36%. Do you think that was a concern? (I missed this entry due to a bathroom break. I'm considering a new setup like the picture attached below :D )

2) In E1: when price crossed 20ema for the first time (the white candle) I found that I was facing the situation that the next bar may take the high of the white candle without taking the low of it first. In that case would you exit? In the book there are several examples when a swing high/low formed, one needs to wait for the opposite side of that swing high/low bar taken out first before tipping point is moved. In this trade four more candles followed with equal lows which formed a cluster. I should've exited at the fourth bar after the candle but I hesitated. It ended up with a small profit as opposed to a loss but I want to make sure I do the right thing.

I wasn't looking at retracements because I thought the market was in consolidation mode. That said, your M1 is probably doable with a possible pull from the 50 level but I viewed the price action at the time as a part of the back and forth around the 60 level.

For your E1, I would've exited where you wanted to given the previous support around the 60 level (though I would've skipped it if I saw this setup in real time because of that support, but that's just my personal view). You don't have to opt for a more aggressive stop; moving the tipping point to the bottom barrier of the block would be sufficient.
 
For the first chart my question is with the double top to the left, is it valid to draw a range like that?

It can be viewed as an IRB. You can draw a line above the double top and see that price halted right under it :p. I was hoping for a magnet effect to the 80 since it looked like the bulls were giving up the 60. I didn't see the level above that double top as a huge level of resistance and I thought the bullish clues were strong enough to take the risk.

I hope I didn't take this one out of boredom.
 
Last edited:
I wasn't looking at retracements because I thought the market was in consolidation mode...

...You don't have to opt for a more aggressive stop; moving the tipping point to the bottom barrier of the block would be sufficient.

Thanks, especially for the above two points!
 
Still trying my luck with ARBs. Had my first and only winner couple of weeks ago, but think I should leave them for the time being.

Hi vanica,

It seems to me that the barrier of the range is quite debatable. You could've lifted the top barrier by 2 or 3 pips and it'd look better.

In Figure 13.5 there are two lows hanging in midair (description on page 225, 3rd paragraph). Yours has only one swing low.

Just my opinion.
 
A tricky day today for EUR/USD with many set ups being skipped due to earlier price action potentially acting as imminent support or resistance in the way of our 10.

I've attached a AUD/USD chart to illustrate a non EUR/USD application of the method.

cool
 
I just took this trade in EURJPY for a profit of 10 pips.
 

Attachments

  • 27-11-2012 10-34-58.png
    27-11-2012 10-34-58.png
    14.7 KB · Views: 239
I just took this trade in EURJPY for a profit of 10 pips.

Took the same trade Virtuesoft. A gimme.

I have just started trading EUR-JPY as a it is trends and has ADR similar to EUR-USD. I am trying to find the lowest spread I can and it can vary between brokers. Can I ask you (or anyone else fot that matter), what kind of spread and commission you pay on this pair?

Cheers,

MArk

I've just started trading it too. This was my first EURJPY trade. I was trading AUDUSD but I decided to try EURJPY instead because I calculated that it is a slightly cheaper pair to trade, and there seems to be more volume and movement.

The spread I'm getting with my broker is typically around 0.5 pips but it can go as low as 0.2 pips (pretty rare), or as high as 1 pip. There is commission that is the equivalent of 0.3 pips to add on top of that. I've attached a screenshot of my quote panel (with the market depth displayed) for EURJPY.
 

Attachments

  • 27-11-2012 13-42-49.png
    27-11-2012 13-42-49.png
    50.6 KB · Views: 166
I've just started trading it too. This was my first EURJPY trade. I was trading AUDUSD but I decided to try EURJPY instead because I calculated that it is a slightly cheaper pair to trade, and there seems to be more volume and movement.

The spread I'm getting with my broker is typically around 0.5 pips but it can go as low as 0.2 pips (pretty rare), or as high as 1 pip. There is commission that is the equivalent of 0.3 pips to add on top of that. I've attached a screenshot of my quote panel (with the market depth displayed) for EURJPY.

Thanks. I trade LMAX and typically spreads and commssion are around 1 pip but sometimes up to 1.3 (I have seen others which are consistantly below 1 pip but am reluctant to switch).

I currenty trade Eur/Usd, Aud/Usd and now Eur/Jpy as well. I don't think this would be possible trading tick charts (I trade 1 minute charts with other filters which means I am only really ever usually focusing on one chart at any time)....

Edit: I like you am trading the aussie less and less (and not on mondays as volatility is poor). See:
Forex Volatility | Forex Volatility Calculator | Volatility Calculation
 
Last edited:
Top