You are using an out of date browser. It may not display this or other websites correctly.
You should upgrade or use an alternative browser.
You should upgrade or use an alternative browser.
samich1262
Well-known member
- Messages
- 293
- Likes
- 3
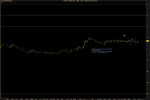
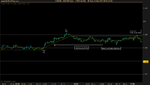
Volatility in the morning suggested more trading and possibly more trading opportunities for today. Unfortunately the trades I took didn't get enough follow through. Or were my expectations too high?
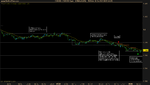
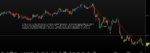
Hmm, the first one looks tricky. Price wanted to retest that block at the 40 level. The little arch on the 40 was 1 pip off of being a ceiling test. We don't get any higher lows near the break, it's more sideways. Seems like when that happens in a ranging environment, those breaks are more likely to fail. Range breaks and BBs that have some nice arches/higher lows in them more clearly show how the pressure is lining up. I did not wake up early today to trade some of the European session, so I didn't get to see this happen live. Since it looks like it could have 50 level support, I'm not sure how I would have treated it.
The ARB is shorting into a 50% retracement and into 50 level support though. I think it is too soon to be bearish especially in a 50 level. I would only look for a bearish move here if the range was much longer. Bulls could be interested in buying at the 50 level. Hope this helps.
BLS
Established member
- Messages
- 642
- Likes
- 229
Volatility in the morning suggested more trading and possibly more trading opportunities for today. Unfortunately the trades I took didn't get enough follow through. Or were my expectations too high?
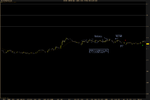
It's easy to get trapped with prices are stuck ranging between two 20-levels during lunch hours (European lunch hours in this case). It's probably best to stay out when price action is moving so slow during this time or to at least wait for better setups. I don't see much of a fight in the first setup relative to that spike that touched the 60. The second setup was better in terms of a fight but it just happened that the market wasn't done with the 50 level yet.
Edit: Don't let price action from 4 or 5 hours ago affect how aggressively you trade. Try to base your decisions on what you can see on the screen.
Last edited:
Thanks for your comments Samich and BLS. Sometimes I pay less attention to the setup itself if I think it fits into what I see as a bigger picture. I try to follow pressure in the market, break/retest of swing extremes and 20levels and if this "story" is supported by a particular setup I can be a bit more flexible with my trade. I considered this to be a right approach, but looking back at my results, it only works when market is more volatile and there are more stop-runs and follow-through. Under current conditions I have to pick both, best setup and best context. I guess this is a change I will need to make.
BLS
Established member
- Messages
- 642
- Likes
- 229
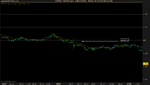
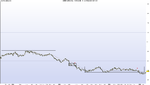
Don't think the idea was wrong, but should have been more aggressive with trailing stop. Possibly moving tipping point to the top barrier of the range would have been a better option.
The way prices came up from what amounted to a false bottom would make me uncomfortable in trading this one. I think you are looking for bullish continuation at the the top of a range (see chart 21 from week 43), though there wasn't much of an upper barrier until the ARB formed (you only have three touches from one high on left) so it kind of looks like an aggressive BB.
I would find it hard to move the tipping point to the barrier in this case since it doesn't seem very solid to me but if you see this kind of stalling near a 20 level, then yes, you should at least move the tipping point to the barrier.
BLS
Established member
- Messages
- 642
- Likes
- 229
Price action was pretty damn boring but at least I found a couple of setups to trade. Still having problems with letting slow trades hit target 😛.
Attachments
stehlikpetrmsncom
Active member
- Messages
- 194
- Likes
- 3
Price action was pretty damn boring but at least I found a couple of setups to trade. Still having problems with letting slow trades hit target 😛.
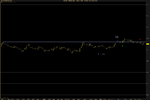
Trades on charts 2, 4 and 5 have something in similar. The ranges that break to the downside after falling from higher top make me uncomfortable and I'm not really sure how to handle them. Do you think you could elaborate on those trades a little bit more?
So far my limited understanding is that it is not wise to trade for continuation in the lows of the range after price fell directly from the high of it, but perhaps sometimes it is doable with a good squeeze, or cluster, that would block the price from crawling back inside the range. The overall picture also has an important say in the setups of this kind. Still, they confuse me a bit.
I didn't have the opportunity to trade today due to internet connection issue, so I'm glad I can see how someone else handled the live trading.
By the way, is there any danger for tiny forex scalpers regarding the results (or anything to do with) the presidential elections in US? I have no idea if it can produce some big intraday moves I wouldn't like to be a part of, so I figured I'd rather ask what do you anticipate.
P.S.: My questions are naturally aimed at all of you, not just BLS. Thanks for any response.
BLS
Established member
- Messages
- 642
- Likes
- 229
I can't really say that the trade in chart 2 was actually bad. I think a number of factors made me hesitate including seeing my earlier trade fail. I don't think I was ready to discard my outlook after my trade failed so I wasn't willing to take a trade to the downside yet. In hindsight we can see some bearish pressure with that prominent lower higher (T) relative to the failed 20 break earlier. The move from the top to the bottom was quite the straightforward move that we see in charts 21 and 24 from week 43. I just wasn't too sure about this one at the time so I decided not to trade it.Trades on charts 2, 4 and 5 have something in similar. The ranges that break to the downside after falling from higher top make me uncomfortable and I'm not really sure how to handle them. Do you think you could elaborate on those trades a little bit more?
So far my limited understanding is that it is not wise to trade for continuation in the lows of the range after price fell directly from the high of it, but perhaps sometimes it is doable with a good squeeze, or cluster, that would block the price from crawling back inside the range. The overall picture also has an important say in the setups of this kind. Still, they confuse me a bit.
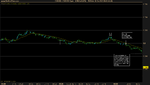
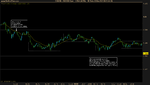
I was more sure about the trade in my fourth chart (E2). There is clear bearish pressure with prices moving in a stepwise fashion. We can see a clear struggle around the 80 level. The bears were dealt a small tease break but managed to keep prices under the 20EMA. We've got a small 2 doji squeeze, which gives us a small risk of 5 pip. This entry was similar to my S1 but I think this setup is a little be stronger in that the price action and risk are more favorable. It's probably a fine line between skipping and taking these kinds of setups so paying attention to the clues you mentioned are paramount to deciding whether or not to trade.
As for the IRB in the fifth chart,that was something I noticed after the fact. I wasn't paying too much attention at the time. I think I was fishing for opinions on this one when I decided to post it. Still, the move from the top to the bottom isn't the straight forward move we see in chart 21 week 43 and that move tested the setup from E2. This might be a trade-able IRB.
I had not thought about that. I think with a race as close as this one that we might not get a clear result for at least a couple of days. I'm not sure though because I have not traded around US presidential elections before. I would say see what the price action looks like on your chart and then decide whether you are going to trade more conservative or not rather than coming in with preconceptions about how price action is going to be.By the way, is there any danger for tiny forex scalpers regarding the results (or anything to do with) the presidential elections in US? I have no idea if it can produce some big intraday moves I wouldn't like to be a part of, so I figured I'd rather ask what do you anticipate.
samich1262
Well-known member
- Messages
- 293
- Likes
- 3

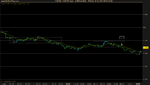
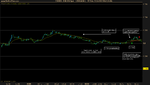
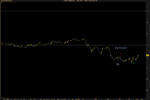
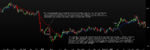
I'm not sure what to do with this situation yet. I knew I should be looking for bullish continuation, but the flag broke without much squeeze. Right now it's climbed up to 77 so it's traveled 16 pip since that break.
I am trying to decide if in certain situations where the flag is very clear, if I should trade these flags as just flags or if I should skip. Looking at it now, this looks like some of the angular RBs that Bob took. It doesn't have the same kind of squeeze that our standard IRB has but if the flag/angular RB is very clear, a lot of people will probably participate, especially because this is not only a break from a trendline but from the bottom of a range. Longing from the top for a standard RB break would almost be riskier. This setup showed strong support at the 60 level.
The sample size of these flags that I have seen is small, but they seem to be high probability trades. Occasionally these show up during the European session, sometimes one right after the other. I have been skipping flags without a squeeze or BB at the end, but the very clear ones seem to be just fine. The flag breaks from close to the bottom of the range, so you've got like a 7 pip risk total which still falls within acceptable risk. What do you think, skip for a better squeeze, or take it if it falls within our acceptable risk/reward?
BLS
Established member
- Messages
- 642
- Likes
- 229
View attachment 148666
What do you think, skip for a better squeeze, or take it if it falls within our acceptable risk/reward?
I'm not too comfortable trading these yet but I would have to base my decision on the overall picture. If I see clear pressure and strong momentum then I might consider trading the break of the angular line instead of a regular setup.
Couldn't find any setups to trade today.
Attachments
stehlikpetrmsncom
Active member
- Messages
- 194
- Likes
- 3
BLS
Established member
- Messages
- 642
- Likes
- 229
@BLS I think there was at least one nice setup - that withtrend BB. It shows a double top which tests the previous low to the left, which is very nice.
Nice catch. I think I'm getting paranoid about continuation patterns around the round number levels.
Don't know if Bob reads the thread or BLS is passing information but just want to say Thank You Bob! Your weekly charts are such a valuable supplement to the book. Repetition hammers this stuff home for me.
I've seen Bob in his weekly charts talk about really paying attention to the IRBs especially in this environment. Also, RBs and BBs. So the ranging patterns mostly. Also, being cautious with the DDs and SBs, which i believe he said were lower prob setups. Not sure if that is because they are trend-dependent and we're not trending as much as when the book was put out.
Does anyone have any data or asked Bob how he rates each of the setups in terms of high to low probability?
I think it would be valuable to know the probabilities of each setup from someone who has a lot of history and experience with the method.
just a thought
Giorrgi
Well-known member
- Messages
- 253
- Likes
- 0
Don't know if Bob reads the thread or BLS is passing information but just want to say Thank You Bob! Your weekly charts are such a valuable supplement to the book. Repetition hammers this stuff home for me.
I've seen Bob in his weekly charts talk about really paying attention to the IRBs especially in this environment. Also, RBs and BBs. So the ranging patterns mostly. Also, being cautious with the DDs and SBs, which i believe he said were lower prob setups. Not sure if that is because they are trend-dependent and we're not trending as much as when the book was put out.
Does anyone have any data or asked Bob how he rates each of the setups in terms of high to low probability?
I think it would be valuable to know the probabilities of each setup from someone who has a lot of history and experience with the method.
just a thought
4-5 pages back one of the posters made a list of all the trades taken by bob in the last month month by looking at the charts he sent us. there were about 4-5 DD/SBs per week against 30-40 break trades (IRBs/BBs/RBs etc). Hopefully this gives you an idea about the probabilities of DD/SB in the current market.
stehlikpetrmsncom
Active member
- Messages
- 194
- Likes
- 3
No trades for me today.
Me neither, I find it hard to read the price action after volatile news that don't result in a new trend. Part of it is also that I have many more bars on my chart and therefore I can always find both bullish and bearish signs, many of them, and can't form a final opinion.
cha-ching
Active member
- Messages
- 148
- Likes
- 9
4-5 pages back one of the posters made a list of all the trades taken by bob in the last month month by looking at the charts he sent us. there were about 4-5 DD/SBs per week against 30-40 break trades (IRBs/BBs/RBs etc). Hopefully this gives you an idea about the probabilities of DD/SB in the current market.
I think he's asking about the probability of success for each setup, instead of the frequency. Say you take 100 DD in 20 weeks, what percentage of them can be considered success?
In the book Bob mentioned SB usually has high success rate if it's a proper setup.
virtuesoft
Member
- Messages
- 94
- Likes
- 2
This week has been the quietest I've experienced. I hadn't made a single trade up until today. However, I thought that the price moved really well today. I made 3 trades in total. 2 were DD's and one was a countertrend RB.
Here are the charts...
Here are the charts...
Attachments
Similar threads
- Replies
- 15
- Views
- 8K