Bob Volman Price Action Scalping

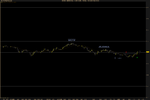
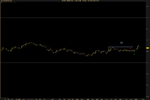
Didn't trade any today. I am a little spooked because I traded a couple tease breaks this week. I was waiting for more squeeze, but most of these had plenty. I'm just making it harder than it should be. The good thing for me is that I am able to see where a setup is likely to develop pretty early on, I just have slid back to being too conservative. Here's my analysis, I watched both the European and morning US sessions today:

Chart1.png

Chart2.png

Chart3.png

Chart4 GBP.png

This last chart is an RB/BB or something that I was watching on the GBP/USD.
 
Hey Samich,

Maybe I should have executed a bit more conservative approach today. With regards to your first chart, how concerned are you about buying the middle of the range (price-wise). I agree that there was proper build-up, but the pressure looked quite even and there was cluster of resistance just above. The presence of round number so close made me just watch this price action.
The range on your third chart didn't look too bad to me. I thought there was enough room to the next chart support and 20 level was basically cracked on the break of the range.
 
What can I say, I'm definitely missing some point with these diagonal pullbacks.

Chart#1: I hesitated on setup in your first chart. I talked myself out of skipping that trade because I was previously distracted. Downward pressure was good and that last false break to the upside is what seemed to seal the deal.

Chart#2: You were right to look for a bounce off the 20 but I think your trade was premature.
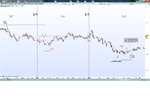
Edit: I should elaborate. That low from the bull move pretty much came from a false low. The top of the bull move hit previous resistance to the left. To me it means that I should be more careful with where I'm going to try to find continuation. I want to see more tension, a more solid signal line, maybe more proof that the market is done with the 20 level at that point. (See attachment)

Chart#3: At this point it doesn't look like a pullback of the earlier bull move but it looks like the bears are flexing their muscles. You can see a series of highers lows with the bulls trying to buy at the 20 level. The bulls did slip up a bit by letting prices dip below the 20 but they bought it back up. Even after that you can see the bears squeezing the bulls for a downward break (bears shorting at lower and lower levels).

Chart#4: I think this was a good trade that just didn't work out.
 

Attachments

  • USD Spot.png
    USD Spot.png
    13.2 KB · Views: 252
Last edited:
Chart#3: At this point it doesn't look like a pullback of the earlier bull move but it looks like the bears are flexing their muscles. You can see a series of highers lows with the bulls trying to buy at the 20 level. The bulls did slip up a bit by letting prices dip below the 20 but they bought it back up. Even after that you can see the bears squeezing the bulls for a downward break (bears shorting at lower and lower levels).

Thanks BLS,

I think many factors mixed up in my head. Probably because of that earlier loss I stubbornly was trying to find another entry in the same direction. On the other hand I saw a head and shoulders type of price action which, I thought, terminated the attempts of bears to push prices lower. I can see that this pullback is rather prolonged and that's why the significance of the previous move up is a bit decreased. Just seems I cannot distinguish between conditions when I should be looking for continuation after such pullbacks and when I should wait longer. The psychology behind is not all that clear to me, so I suppose I will leave them aside for the time being.

I have troubles with bias myself. One way Bob says to counter that is to constantly assess the overall price action in it's current light. I think that means discarding your current outlook and trying to see which way the overall pressure is pointing to at the moment.

One way I try to not to let previous trades affect my decision making for future trades is to take a screenshot of the notes that I have for the taken trade for future reference and then wiping my chart clean. I used to leave them on my chart but that would just be constant reminders of a mistake I made.

I saw that same potential reverse head and shoulders but when prices couldn't really pop up to form the last shoulder I decided that the pattern did no complete itself.
 
Took two trades today. Price action early on in my session kind of confused me so I got bored but I managed to pull myself together to trade today.
 

Attachments

  • Untitled picture2.png
    Untitled picture2.png
    16.6 KB · Views: 243
  • Untitled picture1.png
    Untitled picture1.png
    15.8 KB · Views: 221
  • Untitled picture.png
    Untitled picture.png
    13.4 KB · Views: 202
Btw, would like to thank everyone for participating in this thread. I have no idea how much more time it would take me to grasp some ideas and start paying attention to particular details of this method otherwise. Your thoughts, analysis and suggestions are of a great value to me!
 
Took two trades today. Price action early on in my session kind of confused me so I got bored but I managed to pull myself together to trade today.

The first trade looks quite obvious from hindsight, but I remember at the time there were multiple options where to draw the barrier line, perhaps this one makes sense only because it's break turned out well.

I took the second trade as well, but I think I was just trying too hard, the pressure is rather even afterall.

The third trade I missed but it is a nice example of why it pays off to be alert, good job.
 
The first trade looks quite obvious from hindsight, but I remember at the time there were multiple options where to draw the barrier line, perhaps this one makes sense only because it's break turned out well.

This is how I drew it originally when I saw it set up. I only drew the larger rectangle to give clarity on the lower highs. I'm kicking myself for having to skip this one because I took my eyes off the chart to browse the web while that squeeze was happening :p. When I came back to my chart I saw the breakout but I was frozen with fear because I have a history of taking bad trades right after being distracted.

Well, there's always hindsight bias. You're right, I do have to keep an open mind when studying my trades in hindsight.
 

Attachments

  • USD Spot.png
    USD Spot.png
    11.4 KB · Views: 202
This is how I drew it originally when I saw it set up. I only drew the larger rectangle to give clarity on the lower highs.

So basically you were working with this smaller range and didn't try to match your barrier line to earlier lows? There were several different lows and therefore I thought the squeeze could also be interpreted as failing break or even as front running the entry. This seems like a good solution :)
 
Hey Samich,

Maybe I should have executed a bit more conservative approach today. With regards to your first chart, how concerned are you about buying the middle of the range (price-wise). I agree that there was proper build-up, but the pressure looked quite even and there was cluster of resistance just above. The presence of round number so close made me just watch this price action.
The range on your third chart didn't look too bad to me. I thought there was enough room to the next chart support and 20 level was basically cracked on the break of the range.

In the case of the at first IRB, the setup itself looks a little weak, but I'm starting to rely mostly on conditions instead of the strength of the setup itself. The IRB has support of the round number and looks like the bulls may have won that battle. Another thing that I liked about it was there were a bunch of dojis before the break. They were very compressed compared to the rest of the bars in the box.

Chart #3, the RB on the 20 level may have been tradeable, but since it was both in the 20 level and a 50% retracement, I skipped it. I also skipped the other RB that some others took because I wanted one more lower arch for a more economical entry, but it may have been valid too, I'm not sure.

I didn't take any live trades today, as earlier this week I had trouble identifying the proper "squeeze" in real time. I should've participated, but I got a little spooked. I just marked these setups as they came along this morning.
 
Hey guys,

I am putting together a list of checks and general rules of thumb to try to keep me on the right side of the market during ranges. And to help identify where valid trades might develop early on so I don't miss them. I've been doing it for a couple weeks and I haven't had nearly as many situations where I missed a setup developing. These are my checks for ranging markets.

1. Check nearby price levels first
2. Look for continuation until pressure evens out or there is a giant reversal pattern, then either direction is fair game
3. Watch for retracement
4. Wait for economical entry point, then wait for squeeze

Explanation:
-Check the 20 and round # levels first, not the other way around (ex: I used to look for setups, and then check the location to see if there was a 20 level or round # blocking or supporting it. Now, I check the nearby price levels first. That way if a 20 level is holding, I know that I should be on the lookout for a setup. Or if price is under a 50 level, I know its going to need a powerful setup to crack it. Then when I see a weak BB or something, I'm not tempted to jump in prematurely just because I saw a box develop.

-Continuation: The first thing I look for when a range starts is a continuation trade. Ex, if price was bullilsh before the range, I look for bullish continuation. Specifically, I look for price to hold at a 20 level or a round # at the bottom of the range. I do not look for a bearish entry unless I see a large reversal pattern followed by a setup, OR the range lasts for a long time to the point where the pressure is even. At that point I will consider a bullish or bearish entry. I would not consider myself to be biased towards continuation, more just reading pressure, because as soon as the pressure becomes even, I switch to neutral.

-Avoid trading against 50% price retracements. This is my personal preference right now. If price had the support of a 20 or 50 level, I might take a chance and just trail sharply, but until I make a bit more progress I will treat these as aggressive setups and avoid them.

For the setup itself, if conditions line up, the only real necessary ingredients are a fairly obvious barrier level and the squeeze. If the entry isn't economical I skip it. Squeeze is a little weird to me right now, because it's different identifying it in real time than looking back through a bunch of charts that aren't moving.

This seems to be helping me find points where setups are likely to develop. I used to not see IRBs until it was a little too late and then I hesitated to enter. I am basically following conditions first, and the setup doesn't have to look as perfect. As long as it provides a good entry and squeeze, I pay more attention to determining who is winning overall, and the setup is just the signal to enter. Sometimes the setups this week looked a little messy but if they have all of the ingredients, I think they're still valid. It honestly feels a little weird at first, like I'm operating on a hunch, but I really don't think it is. I think some of us have been basing the probability of a trade working out on the clarity of the box setup itself, when it should be based on the clarity of the overall pressure, what levels are holding in the market, etc... When we think in terms of bears exiting/bulls entering, I am trying to switch to evaluating that on the whole screen, not the setup (unless it's a really lengthy setup), because that's only going to affect short timeframe scalpers like us. That's a really hard switch actually, and it will probably feel weird for me for awhile. It sounds kind of stupid, but a lot of people, like me, are visual learners first. Which explains why a month ago I kept taking BBs in bad places around the chart. Beautiful looking BBs with no real conditional support.
 
And to help identify where valid trades might develop early on so I don't miss them. I've been doing it for a couple weeks and I haven't had nearly as many situations where I missed a setup developing. These are my checks for ranging markets.

Good understanding of priorities!

Agree squeezes are misleading. Sometimes easier in hindsight and sometimes easier in real-time because you can see what resistance/barrier a bar is fighting to overcome. I'm relying more on the ema but need to accept I miss some turns/breaks when the ema lags.

Today I had a weak setup that worked and a strong setup that failed. But like Volman says you trade the probabilities and don't worry about it.
 
Second trade was definitely a mistake. Didn't check the time and entered 5min before the economic release.
 

Attachments

  • 181012a.png
    181012a.png
    20.1 KB · Views: 195
  • 181012b.png
    181012b.png
    18.9 KB · Views: 183
Second trade was definitely a mistake. Didn't check the time and entered 5min before the economic release.

Took the same trade you did but I was a little more aggressive with my stop placement. For that second trade you took, I was actually looking for a bullish break because of the higher lows and support that seemed to hold around the 00 level. Still, we have to be a bit more careful when trading around news releases.
 

Attachments

  • Untitled picture.png
    Untitled picture.png
    16.7 KB · Views: 217
  • Untitled picture1.png
    Untitled picture1.png
    15.1 KB · Views: 178
For that second trade you took, I was actually looking for a bullish break because of the higher lows and support that seemed to hold around the 00 level. Still, we have to be a bit more careful when trading around news releases.

I didn't see a clear bottom in, so when that squeeze on top of 00 level appeared the overall picture suggested a possible IRB. I've noticed that you trail your stop on break of some ranges more aggressively when there is an ARB variation after the break. Is it something you do systematically?
 
I've noticed that you trail your stop on break of some ranges more aggressively when there is an ARB variation after the break. Is it something you do systematically?

I think Bob talks about this in the book but I forget where. If the ARB is valid and if you weren't already in an RB, then you would take it, right? If the ARB stop is good enough for the person that entered on the ARB then it should be good enough for the person that entered on the RB earlier.
 
Second trade was definitely a mistake. Didn't check the time and entered 5min before the economic release.

Took the same first trade as you did, just got out earlier. Not sure about my second trade. Should I pay attention double bottom at 20 level? Also I ignored the real second break.
 

Attachments

  • 20121018a.jpg
    20121018a.jpg
    298.6 KB · Views: 187
Top