samich1262
Well-known member
- Messages
- 293
- Likes
- 3

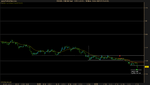
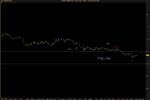
My attachment failed so here's a repost of the RB
View attachment 147400
My attachment failed so here's a repost of the RB
I took the exact same trade and was tempted the entire time to close out early without using the tipping point. I had my head craned forward and my eyes glued to the screen looking for a spot to lower my tipping point to minimize the potential damage. I kept looking at the pip count on my ticket window. When I saw that that big bear candle and "9.2" pip on my ticket I felt vindicated for following the tipping point but at the same time I got excited and closed out my order. I ended up getting 7.3 pip after commission. I don't think I would have made my 10.8 target on my platform though if I let the trade run but I would've gotten pretty damn close.
Managing that trade was very tiring. I think it's because I still care very much about the individual outcomes (I'm a bit of a perfectionist). If I could just learn not to care I would have a more relaxed experience.
You shouldn't base your decision on where to put the tippint point on it's relation to your P&L.
Edit: Also I don't think that was an insufficient squeeze at all at that point of entry!
Hi,
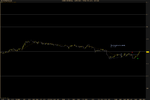
I've noticed that many people took the same short at 2940 level so I will not post my chart. I do agree it felt a bit tricky but compared to other trades I've taken today it didn't look all that bad, so I just gave it a chance. The other trade I took in the afternoon left me frustrated about whether I got the concept of the flag-trades and momentum right. I saw that burst of short selling and a flag-type pullback and thought it had a good chance to have some follow-through. It was right into 50 level, but not sure whether this was specifically reason it didn't work.
You can check out NinjaTrader with a demo account from a broker like MB Trading but you might the tick data isn't always reliable. I have yet to find an alternative to ProRealTime that works as well at it does. I think there's someone here that just uses the 30 second charts on OANDA to trade (TonyLommich).
Has anyone compared MB trading, which has 70Tick available, to prorealtime?
I've noticed that many people took the same short at 2940 level so I will not post my chart.
Hi all
I've been lurking for a while reading most of the past posts on this thread whilst reading bobs book,
which i might add is a riveting read.
So i thought i would drop a post, i am not one for posting much on forums but I'll do my best to contribute.
Guys,
while reading your charts I'm having trouble comparing to the PA on my screen because the hours are different. However Prorealtime does display another hour on the top of its window in parenthesis, and I noticed it was in european format, that is something like 7:36 (14:36). I assume this 14:36 is London time? It seems logical but I'm still asking because I'm having trouble identifying these same setups on my Pathfinder data feed (its in pipettes plus it might not be very accurate).
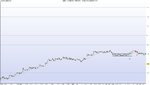
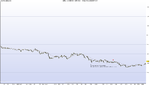
Could you please post your chart so I can note your timeframe compared to the other 3 charts posted. EURUSD stays within the same levels so often I haven't yet aligned all the times up. But with 4 people taking the same trade, I think I'll finally figure it out.
View attachment 147470
Anybody else take this IRB? I got faked out here. Maybe it was too early to look for continuation, but it really looked like the market did not want to go down, and price was lining up right below the 50 level. I thought this looked like a good spot for continuation. Had a good squeeze, a few dojis before the break and even a false break to the downside. Didn't think the double top would be an issue because price couldn't get closer to the 40.