Bob Volman Price Action Scalping

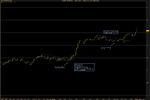
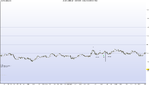
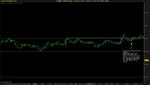
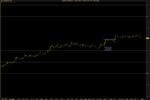
I know we were all split on whether or not it was valid. I just happened to come across this chart while reviewing this evening. Is Volman's example saying that the ARB is risky because of the approaching 40 level in the absence of a ceiling test? Here's a scenario I'm wondering about: Would it still be aggressive if it had 40 level support but no ceiling test?

Hi Samich,

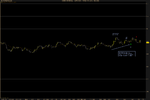
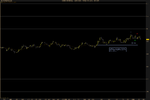
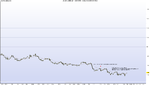
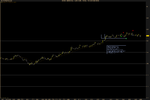
I agree with your logics. Considering the strength of trends and the amount of follow-through recently, every 20 level may represent a serious resistance on the way to the target. That's why looking for setups with proper buildup and, as in this case, test of previous support levels seems to be the most prudent approach at the moment. In my opinion having 20 level as a support would meet the requirement of a successful retest.
 
European morning for me:
 

Attachments

  • 121012a.png
    121012a.png
    24.3 KB · Views: 312
Too late on Friday afternoon to look for new trades, so I'll just post what I've done since morning.
 

Attachments

  • 121012b.png
    121012b.png
    21.4 KB · Views: 205
  • 121012c.png
    121012c.png
    21 KB · Views: 199
My charts today. Went back to managing my trades with the tippint point technique. Stopped caring about the pips so much. I wish there was a way to not see my account balance every time I launch the trading platform, I feel much more relaxed not knowing the exact number of pips I'm up or down for the last week, day or trade.
 

Attachments

  • a1.png
    a1.png
    22.2 KB · Views: 238
  • a2.png
    a2.png
    20.7 KB · Views: 229
  • A3.png
    A3.png
    20.6 KB · Views: 217
No trades for me today. I was a bit distracted today but I think I might be getting too paranoid again - I might be scaring myself out of perfectly healthy trades.
 

Attachments

  • Untitled picture2.png
    Untitled picture2.png
    14.6 KB · Views: 205
  • Untitled picture1.png
    Untitled picture1.png
    13.3 KB · Views: 208
  • Untitled picture.png
    Untitled picture.png
    12.7 KB · Views: 213
My charts today. Went back to managing my trades with the tippint point technique. Stopped caring about the pips so much. I wish there was a way to not see my account balance every time I launch the trading platform, I feel much more relaxed not knowing the exact number of pips I'm up or down for the last week, day or trade.

Didn't take the ARB on your first chart because of the price action in a pullback. I lost money on a similar trade yesterday. It was a bit of a clustered type and I thought there was too much of hesitation after a breakout.
 
No trades for me today. I was a bit distracted today but I think I might be getting too paranoid again - I might be scaring myself out of perfectly healthy trades.

I liked the IRB in your 2nd chart. Lots of tension in that box, and price was having trouble climbing up to the round #.
 
My charts today. Went back to managing my trades with the tippint point technique. Stopped caring about the pips so much. I wish there was a way to not see my account balance every time I launch the trading platform, I feel much more relaxed not knowing the exact number of pips I'm up or down for the last week, day or trade.

I took the same IRB from first chart, I think I panicked when the price got stuck just a few pips above (the small 3 dojis) and exited. I wasn't very confident about the setup because of the little cluster on the left at that level. But then prices resumed (slowly) again.

On your second trade I took all the teases AND your trade... The first tease I immediately saw and exited without losing anything. The second one, to me, looked like it had a much proper buildup. The third one even more so!
 
@stehlikpetr
I was reviewing week 38 charts (the first set shared with us) and saw
2 charts that reminded me of our discussion.
See chart 13 and the note of "too aggressive".
See chart 16 and the note regarding "bullish continuation".

Thanks, that's a nice example. It seems some people got trapped in that pretty exemplary. If I was a countertrend trader, I'd probably try to make some setup of this pattern :)
 
@shotgun77 The only conclusion I can draw from this is that there is no rule to this and I have to assess every situation on it's own :)

@Giorrgi If you took those tease breaks then apart from insufficient build-up there is also the question of your initial stop. There's really isn't a place on the chart that is both logical and economical.
 
Hi All

Have been studying Volman's book and like the approach but one thing has got me stumped. The charts he uses have four digits, so they end at the pip not the tenth. But I can't find a broker or platform that doesn't have the pesky 5th digit. Now we all love the accuracy of it for trading, but does anyone know where to find charting with only four pips? Prorealtime that he uses in the book charges for data, but being a cheapskate I'd like to find something free or cheaper!

Thanks
 
More charts from Bob:

Here are some charts from all of last week's price action, week 41. Hope things are picking up slowly for all you out there.

I noticed a tendency on the forum to over-analyze, which is probably understandable since this was the way I handled many situations in the book myself just to get the message across. However, it may have led to the false impression that every little bar or every up or down tick in it needs to be scrutinized to assess what's currently going on. That is very tiring. To trade the 70 tick in a relaxed manner, I keep track of the current pressures, check for intermediate trends and possible retracement areas and then sort of eyeball the price action without putting too much strain on the mind in terms of analysis. If prices arrive at a favorable location, I focus a little more and hope to see some nice buildup develop. If it looks good enough to trade I just hit the order ticket, and I hit it again in the opposite direction if the trade falls through.
 

Attachments

  • Week41.zip
    1.8 MB · Views: 227
Hi All

Have been studying Volman's book and like the approach but one thing has got me stumped. The charts he uses have four digits, so they end at the pip not the tenth. But I can't find a broker or platform that doesn't have the pesky 5th digit. Now we all love the accuracy of it for trading, but does anyone know where to find charting with only four pips? Prorealtime that he uses in the book charges for data, but being a cheapskate I'd like to find something free or cheaper!

Thanks

You can check out NinjaTrader with a demo account from a broker like MB Trading but you might the tick data isn't always reliable. I have yet to find an alternative to ProRealTime that works as well at it does. I think there's someone here that just uses the 30 second charts on OANDA to trade (TonyLommich).
 
Hi All

Have been studying Volman's book and like the approach but one thing has got me stumped. The charts he uses have four digits, so they end at the pip not the tenth. But I can't find a broker or platform that doesn't have the pesky 5th digit. Now we all love the accuracy of it for trading, but does anyone know where to find charting with only four pips? Prorealtime that he uses in the book charges for data, but being a cheapskate I'd like to find something free or cheaper!

Thanks

You can sign up for igindex and their advanced charts which are prorealtime (or they were several months ago when I used). You need to have opened two positions per month and they rebate the cost. Positions for forex are from 0.50p/point (or around this figure), you need only open and close for the rebate at the end of month. Thus charting is essentially free with the exception of spread. Either way, even if you just spend the spread of two positions on the eur/usd the charting would cost you <£1 a month assuming negligible volatility and no significant draw down in time it took to open & close the position. This is exactly what I used to do for several months before I changed broker.
 
More charts from Bob:

Thank both you and Bob, I'm so glad he finds the time to send these charts. There are some very interesting words on the odds of different trades, which is exactly what has been confusing me this week. This is awesome :)
 
More charts from Bob:

Thanks a lot, Bob and BLS! I appreciate Bob's note about over-analyzing.
Paralysis by analysis is so easy to fall into. Beginners always want "one more thing" for confirmation.
 
I updated the cross reference sheet.
 

Attachments

  • weeklychartref2.jpeg
    weeklychartref2.jpeg
    62.8 KB · Views: 246
  • weeklychartref.xls
    8 KB · Views: 182
Probably after analyzing Bob's charts I was trying to find more setups to trade, but seems I should have started the week a bit more defensively.
 

Attachments

  • 151012a.png
    151012a.png
    21 KB · Views: 278
  • 151012b.png
    151012b.png
    20 KB · Views: 271
  • 151012c.png
    151012c.png
    21.9 KB · Views: 242
  • 151012d.png
    151012d.png
    19.9 KB · Views: 235
  • 151012e.png
    151012e.png
    20.6 KB · Views: 231
View attachment 147398

I just took this RB. Managing RBs is still a toss-up for me between deciding whether or not to use a tipping point technique or exit early if the break stalls. I decided that this break should be trailed aggressively because I didn't like the way the previous bearish move started. There was no ceiling test, but the triple top held price from going back up through the 50 level. I thought that was a good sign, but without a ceiling test I wasn't completely sure if trend=trend continuation was a good bet. Although, the bullish move from the 50 level to 1.296 was uncontested by the resistance to the left. I thought that was an oddity that would not hold up. I guess that might make the lack of a ceiling test less significant. Since the 50 level held, I decided to take the RB and just trail aggressively.

Unfortunately I got caught up in a false break. For some reason I didn't pay much attention to the EMA until after I jumped in. I did get the squeeze shortly after that, but it was a little uncomfortable for a few minutes.

I should have just lowered my tipping point, but price seemed to be stalling and after a little higher low I ended up bailing for a 4 pip profit. The tipping point would have given me at least a break even exit though, so I probably should've just stayed in and moved the tipping point down. Oh well. I participated, so I guess that's a good start on a slow Monday.
 
Top