You are using an out of date browser. It may not display this or other websites correctly.
You should upgrade or use an alternative browser.
You should upgrade or use an alternative browser.
samich1262
Well-known member
- Messages
- 293
- Likes
- 3
Learned my lesson this time and bit the bullet.
This sort of price action is more to my liking. I think I'm done for today. I hate the second half of the NY session.
That one was a beauty. I saw it several bars before it broke but still didn't take it. Definitely a volume problem! Looking forward to next week.
BLS
Established member
- Messages
- 642
- Likes
- 229
That one was a beauty. I saw it several bars before it broke but still didn't take it. Definitely a volume problem! Looking forward to next week.
I'm trading 1 microlot and I still have problems with taking valid trades 😆.
BLS
Established member
- Messages
- 642
- Likes
- 229
Hey BLS,
This is a 1m chart of today, right? Because I missed the same thing on the 70t. I saw it a bit too late. For Vanica, I think it looked even more clear on the 70 tick chart. It came on the end of a 2nd double bottom pattern, the first one being lower. Next week I'm going to cut my volume in half. I think that will help me stop being gun-shy.
Sorry I didn't see this post earlier. It's a 70 tick chart on ProRealTime so it may differ a bit with your charts in NinjaTrader. My chart times are in GMT-7.
samich1262
Well-known member
- Messages
- 293
- Likes
- 3
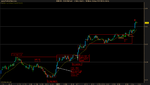
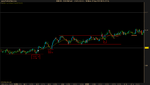
Here's a couple questions I have regarding round numbers. Last week, there were several days where prices hung around the 1.2300 level and I was hesitant to take trades in that zone. I was under the impression that Volman wouldn't take a weak setup like a DD into a round number, only a strong-type setup like a BB or RB. Is this correct or does it depend on the circumstances? What if it's a picture-perfect DD setup?
This chart is from a week ago. It shows 2 trades that I skipped while I try to answer this question. The first is a DD and the second, a BB. I know it didn't quite touch the 20 MA but I disregarded that since the pullback was 50% of the bullish move. Note, the activity prior to the DD setup was quite bullish, trending up for 20-30 pips with healthy pullbacks. I did pass on a beautiful setup into the 1.000 level on USD/CAD. I knew that was a no-no! That level is too significant. As expected, that setup did not work out.
The BB looks pretty decent coming after a triple bottom and a higher low. I may have taken it if that round number had not been there. I know BBs are more powerful setups, but since the market had just made a bearish move, I decided that plus the round number might be too much for the BB to overcome. I am not sure if that was the right move or not. View attachment 142106
BLS
Established member
- Messages
- 642
- Likes
- 229
Here's a couple questions I have regarding round numbers. Last week, there were several days where prices hung around the 1.2300 level and I was hesitant to take trades in that zone. I was under the impression that Volman wouldn't take a weak setup like a DD into a round number, only a strong-type setup like a BB or RB. Is this correct or does it depend on the circumstances? What if it's a picture-perfect DD setup?
This chart is from a week ago. It shows 2 trades that I skipped while I try to answer this question. The first is a DD and the second, a BB. I know it didn't quite touch the 20 MA but I disregarded that since the pullback was 50% of the bullish move. Note, the activity prior to the DD setup was quite bullish, trending up for 20-30 pips with healthy pullbacks. I did pass on a beautiful setup into the 1.000 level on USD/CAD. I knew that was a no-no! That level is too significant. As expected, that setup did not work out.
The BB looks pretty decent coming after a triple bottom and a higher low. I may have taken it if that round number had not been there. I know BBs are more powerful setups, but since the market had just made a bearish move, I decided that plus the round number might be too much for the BB to overcome. I am not sure if that was the right move or not. View attachment 142106
I think you're gonna have to re-upload that chart because I get an error when I click on the link. It does depend on the circumstances but Volman does advise to be extremely careful when taking DD's around the 50 and 00 level because it's more likely that prices won't have a clear path to our 10 pip target. That means skipping the shadier looking setups or skipping healthy setups in slightly more unfavorable conditions (visible support/resistance, weak or strong).
Hi everyone, would appreciate any comments on this ARB trade.

Hi,
I think it's a valid setup, with the only concern being the RN (1.2350) below it. I am just finishing up the Chapter on ARB right now, don't know if you can find out some techniques in later chapters to exit the trade early near RN.
Best regards,
BLS
Established member
- Messages
- 642
- Likes
- 229
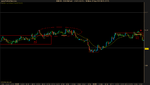
E1 (-6.2 pip): The pullback was a tad short when compared to the with trend move but it was diagonal and one directional. One could have skipped this trade because of the 00 level above but I thought it was worth the risk to take this trade. Prices fell short of my 10 pip target before they reversed and triggered my stop.
E2(+8.3 pip): Wasn't sure about that IRB setup so I skipped it and waited for the break of the range barrier. The pressure inside the second half of the box is unmistakable and it looks like it would be enough to break free of the 00 area. I closed out 1.7 pip early because of my trade earlier that soured on me after it fell short of my target by 1.7 pip. I guess I'm focusing too much on my individual trades rather than focusing on long term profitability. I'm not sure when I can fully accept/understand/think in long term probability.
E3(-3.7 pip): I think I got greedy here. I was up by 2.1 pip by this point and I kept thinking that I could and should do better so I took this weak setup. I had rightly pointed out to myself that that move from the second dotted box straight to the range high was just awkward, especially when prices didn't drop down to test the 20 area. I kept thinking to myself that I wouldn't take this trade unless prices tested the 20 area first but I just wanted to make more money today (I kept thinking that I could have made more today were it not for the first trade) so I convinced myself that the clustering under the range barrier was enough buildup to trade off of.
I need to stop worrying about my P/L while I'm trading.
Attachments
Hello,
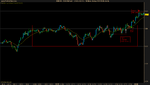
I viewed this BB as an individual setup in a trend but maybe it was possible to trade it as ARB. Prices found resistance at 1.2420 level forming a range. There wasn't enough buildup so I skipped the RB. Would you say there were any criteria this BB didn't meet?

Thanks!
I viewed this BB as an individual setup in a trend but maybe it was possible to trade it as ARB. Prices found resistance at 1.2420 level forming a range. There wasn't enough buildup so I skipped the RB. Would you say there were any criteria this BB didn't meet?
Thanks!
Last edited:

BLS
Established member
- Messages
- 642
- Likes
- 229
Hello,
I viewed this BB as an individual setup in a trend but maybe it was possible to trade it as ARB. Prices found resistance at 1.2420 level forming a range. There wasn't enough buildup so I skipped the RB. Would you say there were any criteria this BB didn't meet?
Thanks!
I don't think there's anything wrong with it. You could not have expected resistance around the 30 level like that based on what was on the chart at the time. I think the RB could have been traded if you wanted to (given the strength of the trend) but it was also okay to skip if you wanted to see a bit more buildup.
Last edited:
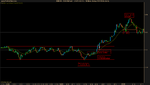
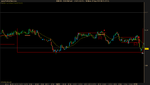
How do you time the break of big trading ranges like the one below without being caught into a false one? Selling pressure leading to the breakout (?) looked maybe even too evident and signal line level was well defined with several swing touches.

Thanks for any comments!
Thanks for any comments!
BLS
Established member
- Messages
- 642
- Likes
- 229
How do you time the break of big trading ranges like the one below without being caught into a false one? Selling pressure leading to the breakout (?) looked maybe even too evident and signal line level was well defined with several swing touches.
Thanks for any comments!
I actually got caught in this one. It's hard to say how one could have avoided this. It's hard to tell how big of a role that low at 1.2415 will play especially when we got such a nice signal line for a (inside) range break. I guess you could assess the strength of a low like that by looking at how prices responded to it. There was a pretty big bull move from that level which would suggest strong support. I say this is hindsight of course because I got caught in this tease break.
But even then there is always a chance that a good looking setup with the right pressure and buildup will fail, it's just that the probability of it succeeding is greater than the probability of it failing/turning into a false/tease break.
BLS
Established member
- Messages
- 642
- Likes
- 229
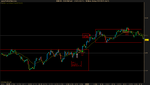
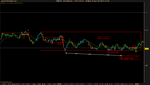
Tough day.
E1 (-0.3 pip) : Resistance at the 40 level was too strong and it ruined this RB trade. I had many opportunities to bail out for some profit but I kept my calm and managed this trade the best I could. With prices having trouble clearing the 00 level I trailed my stop carefully, trying to make sure that it wasn't too aggressive. I get stopped out eventually for a small loss.
E2 (-4.1 pip): I thought it was worth the risk to see if prices could clear the 40 level this time so I didn't take too much stock of the visible chart resistance (ellipse) around the 40 level from my first trade. In hindsight I think I should've skipped this trade. I probably should have stopped trading as long as prices were stuck in this range (roughly between the 20 and 40 levels). But everything is clearer in hindsight. I think I was pressing for trades because I wanted to make more money than I did last week and I was a bit frustrated with this price action.
E3 (-6.7 pip): Here I go again trying to buy into obvious resistance with this IRB trade. I thought the bears were losing the fight when I saw that false break to the downside of the IRB setup but they had one last trick up their sleeve. Maybe today just wasn't a good day. Maybe I should've just sat on my hands and waited for prices to clear this range.
E4 (-5.9 pip): I thought this was a really nice trade. We have a series of distinct lower lows and clear level of support that the bulls were defending well. The bears are shorting at lower and lower levels while the bulls are buying at the same level again and again. A classic squeeze situation right? I thought so. Turns out that low (white arrow) was an even stronger level of support and the bulls came pouring in when that level was hit again. In hindsight I probably should have paid more attention to that low given how strongly the bulls reacted to the first time but the signal line, that support level, was just so strong that I may have taken this trade anyway.
Attachments
williamsf1_fan
Junior member
- Messages
- 14
- Likes
- 1
Newbie question- really like look of Bobs book but would prefer to focus on 5 or 15 min price action. Do the techniques/setups extend out from 70 tick charts to these longer timeframes?
Many thanks
Many thanks
BLS
Established member
- Messages
- 642
- Likes
- 229
Newbie question- really like look of Bobs book but would prefer to focus on 5 or 15 min price action. Do the techniques/setups extend out from 70 tick charts to these longer timeframes?
Many thanks
You might want to take a look at Al Brooks' books since he focuses on the 5 minutes time frame. I'm not too sure if Bob's method would work well on the 5 or 15 minutes time frames. The price action principles should be universal but the setups themselves may not appear often enough to trade.
williamsf1_fan
Junior member
- Messages
- 14
- Likes
- 1
Thank you for your quick reply.
Much appreciated
Much appreciated

Similar threads
- Replies
- 15
- Views
- 8K