matty_dunn
Active member
- Messages
- 188
- Likes
- 17
More charts from Bob
Thanks Bob and BLS
More charts from Bob
More charts from Bob
i really want to learn this method of trading
can any one tell me where to start?
thnx all
Hey ptsnu,
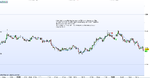
Thanks a lot for your input. I especially appreciate your comments about picture 2 (the failed IRB). I haven't looked at it from your perspective, great insight !
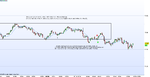
I have a question about tease breaks ! I know that false breaks are usually a sign that the prices will tend to go in the direction contrary to the direction of the false break. That is very clear. Tease breaks on the other hand are almost never analyzed like this by Volman. Usually a tease break happens, then we wait a little for a proper build up and trade it in the same direction. Therefore a tease break isn't a sign that prices will go in the other direction. However, there is one chart that I reread lately in the book where Volman says that a tease break was evidence of prices moving in the other direction (12.9, last chart in the IRB chapter). This disturbs me. If anyone could clear up the role of the tease break as a technical analysis tool that would be great.
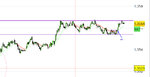
The RB in picture 4 broke in about 1 second on my screen. Probably because my connection was lagging and loaded it all at the same time.
Hey ptsnu,
However, there is one chart that I reread lately in the book where Volman says that a tease break was evidence of prices moving in the other direction (12.9, last chart in the IRB chapter). This disturbs me. If anyone could clear up the role of the tease break as a technical analysis tool that would be great.
Good morning guys,
setups I have seen so far today. I would appreaciate any input.
Cheers,
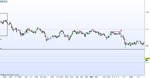
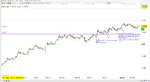
I took the trade that you labelled as a SB. However, I traded it as an ARB. I went long when the price pulled back and formed those dojis at the previous breakout level.
The price moved up and got to within half a pip of my target. It then headed down and I exited when the 20 EMA broke for a profit of just 1.5 pips. The exact same thing happened to my trade from yesterday. It's frustrating to see the price get so close to the target and then have to close it around break even.
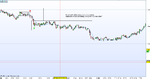
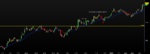
I had more luck with my other trade from this morning. It was a DD setup in EURJPY. This one had no problems reaching the target.
Interesting ARB.
I agree with u, I had enough of targets going til 9.8 pips profit to then reavearse and having to scratch.
What is ur TP, 10, 10.5 or 11?
Cool setup, did u consider the minicluster at the left of DD that followed the diagonal pullback? got to love pullbacks with that percentage of retracement.
How many pips are u paying in total comision plus spread for EJ?
My TP is 10.
I didn't mind that prior high because the price seemed to bounce right off it. It was also some way back and the trend looked very strong.
My TP is 10.
The spread on EURJPY is typically between 0.7 and 1.1 pips. I also pay $15 USD per million so I'm effectively paying an extra 0.3 pips per round turn. It's quite a bit more expensive than EURUSD but it does move well. It has strong moves and quite often exceeds my target by more than a few pips. I'm starting to think that I should use a 12 pip target for EURJPY.