Bob Volman Price Action Scalping

I think I skipped a good BB today (first BB, first chart). I was able to catch a nice RB later on though.

I skipped that BB too, thought it was too early. But I think that next pullback could have been traded, it looks similar to the aggressive bear flag from the new charts we got this weekend. So it might be best to skip. I was eyeing it and decided to skip that one too.
 
My trades today.
 

Attachments

  • a4.png
    a4.png
    20.7 KB · Views: 220
  • a5.png
    a5.png
    20.1 KB · Views: 202
My trades today.

I almost took that BB but skipped because if you draw it as a bull flag, the BB is outside of the flag. I really don't know if that matters, but for the most conservative setup I wanted the BB back inside the flag and inside the average there. Otherwise, it seemed like hesitation on the part of the bulls, like it broke from the flag and just couldn't go anywhere. But I don't know if that's the right call, just my thought process. Lol, last time I thought I was on the right track I was taking some pretty bad BBs!
 
Hey guys,

I've noticed some of you traded this RB:
15whwna.png


Did you consider current conditions favorable?

Thanks
 
Hey guys,

I've noticed some of you traded this RB:
15whwna.png


Did you consider current conditions favorable?

Thanks

I didn't trade it because I am skipping IRBs until I know I'm seeing them correctly but...

Looking at it as an RB it does look kind of bad. But I was looking at it as an IRB. It put in a double bottom, 3 dojis, crossed above the average and broke through a visible resistance line. I thought that it was ok, just might require some close trailing. Those dojis allow for a fairly tight stop. It's only risking 5 pips. Interested to see what others think about it.
 
I almost took that BB but skipped because if you draw it as a bull flag, the BB is outside of the flag. I really don't know if that matters, but for the most conservative setup I wanted the BB back inside the flag and inside the average there. Otherwise, it seemed like hesitation on the part of the bulls, like it broke from the flag and just couldn't go anywhere. But I don't know if that's the right call, just my thought process. Lol, last time I thought I was on the right track I was taking some pretty bad BBs!

Yes, that's a good note. If the bears were able to push the price deep below the flag, they are probably getting strong.

I never know if these scenarios if it's a good thing or a bad thing:

There is some barrier that gets broken by let's say 10 pips but soon price returns back below the barrier and pushes back again. Is it pro-trade or against trade?


@vanica I think so, the tops are far away enough to eventually scratch the trade if they prove to be too strong.

Hmm, I'm not really sure, its hard to visualize without seeing a chart. Check Figure 11.7 in the book. Something like that maybe?
 
Hmm, I'm not really sure, its hard to visualize without seeing a chart. Check Figure 11.7 in the book. Something like that maybe?

Yes, something like that or like the bull flag scenaio we were discussing. But I'd like to understand it from the theoretical side.

1/ There is a clear barrier - it's not really a range, but simply a line that bulls are pushing on.
2/ The barrier gets broken, it's not a fake break or tease.
3/ However, price doesn't travel too far and eventually gets back under the barrier and starts pushing on it again.

In such a scenario, would it be wise to trade a BB for example?

It could probably be done in the right circumstances. If you have the new charts look at #13. The aggressive bull flag. It doesn't go 10 pips or even close, but it does break the barrier level with 3 bars by a few pip. Something like that maybe?
 
View attachment 145754

The big thing I'm looking for is whether or not my trend markings are correct (A to B, C to D) That B is supposed to be a little lower btw, right at the start of the bigger countertrend.

There's a degree of subjectivity in how you want to label the trend moves so I can't really say whether you are "right" or "wrong" in your labeling. Bob used that labeling in his latest charts to get us to start thinking about the overall price action. That said I would put my "A" right above the big red candle. I have attached a chart with my take on the labeling but take note that I'm labeling more than just the bigger moves for clarity so I have more letters. I am be no means trying to suggest that my labeling is more correct than yours.

First, I think the break of the range may have been tradeable ARB if you move the barrier back a pip or two from that line I drew, but there were so many touches to the line that I didn't know if it was valid or not.
I'd call that a regular RB.

I guess that pullback into the EMA near B could be considered a DD but it looks pretty aggressive, and there's no way to tell if price is ready to break yet. This was not really a trend = trend situation. After B in the middle of the following pullback there's another potential DD but if we're measuring A-B as the bearish move, then that's not near enough pullback. It does use the bottom of the previous pullback as support though. What do you think about this?
I see a fresh breakout, possibly a new trend move. Not good enough for a FB but with the risk at around 5 pip, it's a good SB to take. See number 1 on my chart.

The pullback extends and comes back into the average for the 2nd time, giving us the DD at point C, which is a much better trade to my eye. It's a 50% retracement of the larger move from A to B.
I see a head and shoulders formation around the 40 but other than that is seems like a good mini BB. See number 2 on my chart.

The next DD that I marked pulls back into support. It's not a great pullback and may be a questionable setup. What do you think of it? Should it be skipped? Should I have moved that entry further to the right? Because the pullback does look a little better then.
Tradeable but aggressive for me. Pullback is a bit shallow but it does test an earlier low; depends how you look at it, I might not be seeing enough of the overall picture. I see some hesitation around 1.6236 and would consider that move down to be a mini-continuation/breakout. I guess Bob would say either skip or trail sharply. See number 3 on my chart.

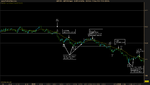
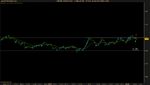
If I'm measuring this trend right and C to D is the next major leg, then we should definitely skip that DD in between D and E. A week ago I would've taken it because I would have considered that questionable DD right before it the start of a new leg. But that pullback wasn't very significant, so I left C up there after the larger countertrend. I am not sure if I should've put D lower where I did, or if I should've put it at this questionable DD. The next setup will clarify why I am confused about this:

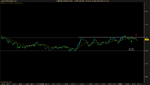
E makes a pretty good bear flag. The later DD is much better, but here's where again, I get confused. If I marked C to D correctly, then D to E isn't a long enough pullback. But if we measure from that 2nd DD trade, it's a 50% retracement and looks like a very good trade. But then that makes the false DD in the middle of the countertrend look like a sufficient pullback.
That's one terrible pullback for a DD. The bar starting the pullback it bigger than any other bar in the with trend move. Sure, it worked out but I wouldn't take it. See number 4 on my chart.

My final assumption was that I had marked the legs correctly and that last bear flag should be traded. Hopefully I'm going in the right direction here but I'd like to know what you guys see here. Regardless, the bear flags on Bob's new charts helped me a lot. Even when I go back through the book now, some of the more difficult SB and DD setups make a lot more sense to me now.

All of the above is just my take on it; take it with a grain of salt. It's good that you're thinking more about the overall picture now. I will try to do the same.

For future posts like this please mark your charts with more details to reference to. Take my chart as an example for using more reference points. It was a bit hard/time-consuming to follow your post with your chart (gah, maybe I was just feeling sleepy/foggy after lunch).
 

Attachments

  • USD Spot.png
    USD Spot.png
    15.9 KB · Views: 232
Last edited:
My trade today. For the DD the previous swing high (at about 8:04 on the chart) was at the same level at the pullback low. Can I assume it was tested just before the setup so that it's no longer unfavorable? Or should I wait for at least another bar which has a higher top? In the book I saw previous S/R level in the path of reaching the target but in this case it's exact the same level.

I know the trend and pullback weren't that great either, so probably I should've skipped it anyway.

What about the SB a few minutes later? I remember Bob mentioned somewhere its requirements for the trend and pullback are similar to those of DD, so if I had skipped the DD, then I should've skipped this SB as well?

Thanks,
 

Attachments

  • 20120925a.jpg
    20120925a.jpg
    261.1 KB · Views: 213
What about the SB a few minutes later? I remember Bob mentioned somewhere its requirements for the trend and pullback are similar to those of DD, so if I had skipped the DD, then I should've skipped this SB as well?

Thanks,

I think that double top at the round number zone was enough to consider skipping this trade (even though it worked). That's in terms of location. Not sure how you treat SBs with the extreme of the second countertrend move breaking the extreme of the first pullback, but I prefer to skip them.
 
Last edited:
Hi everyone !
Very interesting thread.
Want to join you guys in the discussion.

Start with a chart.
Aussie was in a well defined range, tried breaking lower but failed. Pushed to the top of the range and started to build up pressure. Price broke out, entered on the retest of the range. Target at the recent swing high.

I haven't really used tick charts before but it just seems easier to "see" what price is doing and define ranges.
 

Attachments

  • fx01 17.28 Wednesday, September 26, 2012.jpg
    fx01 17.28 Wednesday, September 26, 2012.jpg
    204.7 KB · Views: 1,142
E1: Came back to the my computer after a little time away and saw the first break of the range. Then I saw the small crawl back into the range and immediately thought "ARB pullback". At the very least I should've had my stop one pip lower to match that low to the left.

E2: Redrew my upper barrier one pip higher and saw this nice squeeze. I had to take it.

E3: I tried not to take and revenge trades after my first two trades but I think I ended up doing it anyway.
 

Attachments

  • USD Spot1-1.png
    USD Spot1-1.png
    11.5 KB · Views: 205
  • USD Spot1-2.png
    USD Spot1-2.png
    11.4 KB · Views: 194
  • Untitled picture.png
    Untitled picture.png
    16.3 KB · Views: 193
  • Untitled picture1.png
    Untitled picture1.png
    15.1 KB · Views: 194
I finished my BB analysis review of 220 charts.

BB analysis based on:
Range fade
Range breakout
Trend reversal
Trend continuation

Range fade: Overlap with IRBs so some duplication of charts.
Gain rate: 78%
Losses occurred when resistance in both directions.
Ema doesn't matter much if BB well-formed.
Range leg must show some topping or bottoming action for fade.
BB must form for a reason at its location - test of SH, SL, DB, DT, etc.

Range breakout: Overlap with RBs so only a few in the BB category.
Win rate: 80% but data sample small. Wait for RB analysis.
Ema slope important.
EMA squeeze or BB compression when breakout occurs at extreme
in direction of extreme (at high for long breakout)
If at opposite end of range and looking for range BO, some kind
of strong reversal action must be evident. Might have a few
higher lows or a triple bottom to indicate range BO topside.
More info forthcoming when analyze range screenshots.
Overlap in study between IRBs, BBs, and RBs.

Trend reversal: Not a Volman context but I figure the BB might
be an early one for a new trend in opposite direction.
Gain rate: 60%
Most gains required strong/obvious bottoming action near a prior support zone to reverse up
or strong/obvious topping action near a prior reversal zone to reverse down. EMA nearby but
not offering squeeze usually. Do not take if barrier in way to target. Can get stop outs if
weak reversal action on very strong trends and price needs to do a retest to confirm reversal.

Trend continuation: Needs more analysis to break down
some of the components.
Gain rate: 67%
EMA slope important for direction. Also must be at or near EMA
unless there was a sudden surge that broke away then formed horiz BB.
Take direction of strongest pressure but in general follow the major trend.
EMA squeeze or compressed bars relative to size of trend bars.
Don't take horiz BB late in trend with prior PBs unless clear pressure.
If trend very strong, after pullback, in the trend continuation leg,
OK if BBs build on top of each other.
Stairstepping trends with steep slope to EMA line then OK
if BBs build on top of each other if not extended (# of bars small).
But watch out for gap opens that go sideways.
Watch out for channels with overlapping swings. No clear BBs in them.

Harder conditions to read:
wide range with multiple barriers.
channel with volatile swings.
Trending then sideways consolidation. Not diagonal PB.
 
I finished my BB analysis review of 220 charts.

BB analysis based on:
Range fade
Range breakout
Trend reversal
Trend continuation

Nice analysis. Are these based on many individual stocks or just a few? Or index?
 
Last edited:
927 Trade.png

Hmm. Just had a failed BB. See anything wrong with this? Not enough pullback maybe? Round # pull?
 
Top