Bob Volman Price Action Scalping

BLS, Good notes on your charts. What does the S: or M: mean?

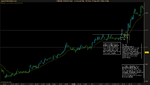
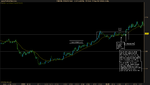
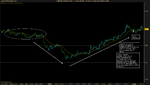
On your chart that shows the RB and ARB between 4:40 and 4:48, I thought it looked like 11.6 pg. 159 in the book. Would you agree?

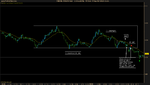
S means I saw the setup at the time but decided to skip it. M means I missed the trade because I didn't see the setup at the time. I missed that DD setup because I didn't see it as a DD until it broke a few pip away from the desired entry. E just means an actual entry I took. I did leave out E2 for that SB that I took, sorry if that was confusing.

It does look a lot like 11.6 in the book but I would say that 11.6 had a much clearer bottom barrier, at least for an RB. I think the ARB is a much better entry but even after the ARB entry there was still some uncertainty among the trader.
 
Cha-ching, I'm not sure I agree with how this box was drawn. It looks more like a slow down-trend to me, starting at about 7:20. Especially with most bars below the EMA. I don't like trading them.

I read the 8:08 spike as a failed pullback, and your small range block as a pullback BB in the continuing downtrend.

So many ways to read this stuff it drives one nuts.

John

Thank you and stehlikpetrmsncom for your input. I found this thread very helpful to me. I hope I'll have a much better understanding once I finish the second read of Volman's book.
 
Hi everyone
I have read Volman's book, and in my opinion the set-ups are essentially either trading pullbacks in a trend, or trading range breakouts, so nothing new there. I liked the trading psychology bits, but otherwise thought it was a waste of time personally. However to all those of you
using his set-ups I wish you all the best.

Hi, if you considered this book waste of time, then I'd love to hear about books you considered worth of reading. I mean it, I think this book is brilliant, but I didn't read that many trading books and I'd appreciate recommendations :)
 
Hi, I have read about 60 trading books. The ones I can recommend are Reminiscences of a stock operator by Edwin Lefevre, Come into my trading room by Alexander Elder, Trading price action trends, trading ranges, reversal (three book series) by Al Brooks, The Art & Science of technical analysis by Adam Grimes, and Market Wizards by Jack Schwager.
 
I thought this SB looked like a good bet, 50% pullback with 50 level support, but it didn't work out. It's ok though, I only lost 3.5 pips on it, so it was economical. Some resistance, but I didn't think it was anything major. Nice uniform pullback. Is it just me, or does the SB seem like a lower odds setup? It's usually economical so it must work out in the long run, but I see a lot of them fail. It might have 50/50 odds which is still pretty good, but it seems to me that a well compressed DD setup or a BB in a pullback have much higher odds.

917 Bad SB.png

I am going to try to get my 2nd monitor today because I missed the entrance to this beautiful BB on the GBP/USD pair:

917 GBP BB.png

Pretty solid BB if you ask me. 3 higher lows within the box and 6 equal touches of the barrier with dojis before the break. Right on a 50 level too. Looked like pretty good odds.
 
Hi, today the chart was moving quite a lot, but I felt like it was hijacked by higher timeframes, or was it just me who couldn't make much sense of the movements?

I traded 2 inferior trades (first with unfavourable conditions, second was odd setup but had good underlying forces) and 1 ok ARB. I'm gonna have to go through this chart again later, I can't believe there was this little opportunity today considering how much it was moving. How did you guys do?
 

Attachments

  • zzz.jpg
    zzz.jpg
    245 KB · Views: 194
  • yyy.jpg
    yyy.jpg
    190.5 KB · Views: 164
Hi,

I felt the same way about EUR/USD, but the AUD/USD had a nice SB and a DD that worked out. I think AUD and GBP move similar enough and with enough volume to trade these setups for 10 pips, but the CAD doesn't move enough unless there's a big CAD news announcement.

The first DD I skipped, because the dojis are no more compressed than most of the bars in the pullback. They're all 2 pip except for one 3 pip bar and one bigger one. I was waiting for two 1pip dojis but never saw them so I didn't take that setup. I skipped the 2nd one and considered trading it as a BB but the stop would have been non economical. It would have worked out as a BB though, it just wasn't idea without dojis for the break. Pressure was up, so maybe it'd be ok, but I waited for a more conservative setup.

The ARB setup looks nice. I didn't take it, but wish I had. The range was just so tall that I kind of expected it to make another lower low inside the range before breaking it, but it did have a nice retest. I'm skipping a lot of IRBs and ARBs right now until I get better at them.

All I did was take an SB on EUR/USD (posted it a little bit ago). Lost 3 pips or so. But it's ok, I think it was an ok setup.
 
By the way, I saw that somebody posted that Volman's method was a waste of time. If anybody is on the fence about Volman's method, I am certain it works, it just takes a lot of practice. I've read several other books too and I'm pretty sure the Volman method has by far the most profit potential. The book takes multiple reads and you really need a lot of practice and some confidence to get it down. If you just read the book once or twice, that's probably not enough. I am only marginally profitable in live trading so far but on many days I have some nice win streaks during my practice sessions. It's only a matter of time before that translates to the live market, so I would encourage everybody to stick with it. It's a pretty in-depth method, it won't come without solid dedication.
 
917 AUD.png

Here were the AUD/USD moves. What a bummer, I didn't check it for over an hour and I missed all of this. Looks like a BB/RB with an ARB for a retest, an SB that turned into a BB, and a DD. So the first 2 big moves even had 2nd chance opportunities.
 
Hi, today the chart was moving quite a lot, but I felt like it was hijacked by higher timeframes, or was it just me who couldn't make much sense of the movements?

I traded 2 inferior trades (first with unfavourable conditions, second was odd setup but had good underlying forces) and 1 ok ARB. I'm gonna have to go through this chart again later, I can't believe there was this little opportunity today considering how much it was moving. How did you guys do?

I took the same trades you did except for the DD. Yeah, that surge just came out of nowhere. I couldn't find any other opportunities either.
 

Attachments

  • USD Spot.png
    USD Spot.png
    15.1 KB · Views: 221
Hi BLS,

I just looked at your analysis of your charts. What I have noticed is that you describe what is happening in the market, but I haven't seen you anticipate an actual set up.

I haven't read Volman's book, but he must have well described set ups. I think it would help if you would anticipate a set up instead of reacting on what is happening in the market. For example price is forming a set up called double bottom and you take a long scalp when you see price, just after creating a second bottom, go through the MA.

What helped me with my scalping was analyzing multiple time frames. By analyzing the 15 min and 5 min charts I have a good notion where support and resistance areas are. This way I can estimate how far price possibly would trend and that there is still room for me to scalp in the direction of that trend.

I hope this will help you with your scalping.

Kind regards, Zonescalper

Hey Zonescalper, welcome to the thread.

I haven't ignored your post, I just needed some time to think about it. Right now I'm trying to trade like Volman but I'm finding that hard. Some different perspectives would be helpful as I try to find my own way/style of scalping with Volman's method.

For much of Volman's method we have to pay attention for clues that tell use which way the market may be headed next. It can be anything from a triple bottom or just tiny higher high, it all depends on the context in which that clue appears. After you have a feel of the pressure, that's when you start thinking about possible set ups. That's why I describe what is happening in the market on my charts.

If you take a look at that missed DD setup from my chart, you can see that I anticipated a failed first break (FB), and that clouded my vision so much so that I missed the double doji (DD) right after. That's the problem I have with trying to anticipate setups. That's not to say that I don't look for setups, it's just hard to look for a particular type of setup (Volman has 7 of them), for me at least. I'm not sure if you meant looking for a particular setup or looking for setups in general but I do have problems thinking about possible setups. I used to try to find setups all the time but that led me to pay less attention to the overall pressure. Now I'm not paying enough attention to possible setups forming. I'm trying to find a balance.

The problem with multi-time frame analysis, at least in Volman's view, is that is adds a layer of complexity to a relatively simple scalping method. Ideally we would only want to focus on one chart instead of 2 or 3. We also want to focus our attention as much as possible to reading price action rather than thinking about different profit targets, that's why Volman just has a 10 pip limit for all trades. That said I do keep an eye on the 1 minute chart to try to get a feel of what other scalpers are seeing. If the setup I'm looking at in the 70 tick chart appears in other time frame charts, then that setup has a higher chance of succeeding.

Thanks for your suggestions Zonescalper.
 
Some other charts from today.
 

Attachments

  • Untitled picture2.png
    Untitled picture2.png
    18.3 KB · Views: 236
  • Untitled picture1.png
    Untitled picture1.png
    16.5 KB · Views: 206
  • Untitled picture.png
    Untitled picture.png
    16.9 KB · Views: 229
I thought this SB looked like a good bet, 50% pullback with 50 level support, but it didn't work out. It's ok though, I only lost 3.5 pips on it, so it was economical. Some resistance, but I didn't think it was anything major. Nice uniform pullback. Is it just me, or does the SB seem like a lower odds setup? It's usually economical so it must work out in the long run, but I see a lot of them fail. It might have 50/50 odds which is still pretty good, but it seems to me that a well compressed DD setup or a BB in a pullback have much higher odds.

Regarding the SB, I recall Bob writing that we should take it on the next bar after the little swing high/low, as you did. But my experience is that the second leg of an SB requires a little more distance in time and price. At the least it should test the prior extreme of the pullback's first leg. Once that happened in your example, the entry would have fine. This is what I now look for in SBs.

I find SBs more reliable that DDs. In fact, second entries are considered among the most reliable trades. I just think we need to give them some time and wait for a failed retest of the first leg extreme.

John

Thanks John! So do you only take SBs that have a double bottom to the pip, or can the lows be 1 or 2 pip apart? You're looking for a rather pronounced W pattern rather than a quick FB to the upside then?
 
Thanks John! So do you only take SBs that have a double bottom to the pip, or can the lows be 1 or 2 pip apart? You're looking for a rather pronounced W pattern rather than a quick FB to the upside then?

Hi, I'd like to add my view on the SB as well. I didn't use to trade them for very long, but then I've re-read the chapter from the book and came to the conclusion that it is probably the most difficult setup along with BB. The reason for it is there is no one pattern that would represent either BB or SB, they come in very different shapes and market environments.

I am absolutely sure that the lows can be 1 or 2 pip apart, the second low can even go lower if it's a fake break that quickly and rather agressively returns back above. What is important is the context, I can imagine most trader don't really care if our small SB setup was tested to the pip or not, they trade the big picture.

I very rarely trade SB, because I think you already need some experience with the market to know when it's high odds and when it's not, so I am often hesitant and miss it.

Regarding the SB in question, I think it depends on whether you count that pullback as first or second: if it's first, then we have 50% retracement, however if it's second, we have about 200% retracement.
 
Thanks. Yeah, I knew they could be 1 pip apart, I just wondered if that significantly decreased the odds in this market. It seems like a basic setup but I have only seen like one a week for the past month and I don't find them as easy as DDs and BBs. I don't know why. Maybe because the market was trending more in July when I started, and SBs seemed more common then.
 
Brain Games & Brain Training - Lumosity - What do you think, clever marketing or potential for improvement in trading performance? The games are fun but I can't tell if they make your cognitive functions better overall or you just get better at playing that particular game.

I am interested in what you do outside the chart that helps you trade better, how do you keep your focus, fight boredom, what kind of activities do you do throughout the trading session?
 
Man, I cannot win a BB unless it's either trending, or inside the barrier as part of an RB. I am not sure if this was the right decision.

Bad BB ARB.png

Should I have waited for a higher low or a doji on the barrier, or do you think this was an acceptable setup?

It's a bummer that I took it on the EUR/USD and not the GBP/USD because if I had done that, I could've raised the tipping point for a 3 pip gain. It had more support but on that chart, there were no dojis close to the barrier before the break and I didn't like the lack of pressure. At least on this chart, there was a little pressure.
 
1/ DD - I can't really complain that it didn't go my way if you look at the point from which the trend initiated, was I supposed to even trade this? I am losing most pips on DD setups because it's so easy to see them everywhere. I have to learn to pass on most of them.

2/ RB - This setup also looks a little akward, but because the price was moving up and down all day and this setup is on the upper side of the chart, I felt like taking it. High odds or not?

3/ IRB - I exited the trade early, above a support and above EMA, but I had technical reasons for it - fake break of the box that formed above the barrier. After that, I could be sure that I am no longer playing a RB trade, even though chart technically there were no lower highs and such.
 

Attachments

  • 11.jpg
    11.jpg
    129.7 KB · Views: 231
  • 22.jpg
    22.jpg
    121.1 KB · Views: 201
  • 33.jpg
    33.jpg
    156.1 KB · Views: 225
Top