Bob Volman Price Action Scalping

Hi, these are my trades today. I excluded 2 or 3 invalid trades I took, because there is not much to learn.

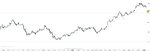
1/ DD - The trend has surpassed 00 number by more than 10 pips, both leg and pullback are clear and diagonal, candles in the pullback are on average smaller then candles in the leg of the trend, dojis nesting on the EMA.

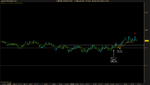
2/ IRB - This was a complicated trade. The range here was obvious, but the bottom barrier wasn't that clear and about 12 pips below (low of the previous box) was a distinctive low where other traders might want to buy. With these two factors, I decided it would provide me with better odds to trade IRB with a wider stop, than RB with tight stop (because the barrier wasn't that clear at the moment of my IRB + potential support not too far away). In the little box I entered my IRB with stop above the distinctive rejected high (candle sticking it's tail out of the box). Although the IRB didn't technically workout (prices took off the barrier once more before RB occured), I felt safe because there was a serious number of lower highs and my stop was very well placed

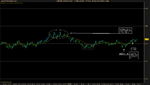
3/ IRB/BB - This was an unusual trade as well. Although clearly in range, it was hard to tell where upper barrier should be. At around 17:00, I wasn't going to trade this. But then a beautiful BB appeared and the chart suddenly looked like it wants to be traded to the upside on the break of the box. Prices didn't exactly burst out of the box, but perhaps did what was necessary for a RB that occured not that long after - provided enough bullish sings to convince sideline bulls.

4,5,6/ Invalid setups and/or unfavourable conditions :)
 

Attachments

  • Obrázek 1.jpg
    Obrázek 1.jpg
    120.8 KB · Views: 285
  • Obrázek 2.jpg
    Obrázek 2.jpg
    152.8 KB · Views: 232
I was wrong and would have been stopped out anyway!
I guess that I was trying to trade an IRB that could have worked but the support down at 1,2565 was to strong..I can see that I should have waited and not moved up my support from this level since it still had significance..
Maybe I should have looked at the dip below 1,2569 as a F tease since it went straight down from the top of the block? What do you think?

I like Monday's 9/3 RB/IRB better as an IRB than a RB. Though when I looked at your screenshot, I was biased to see the IRB as a long instead of short.

As an RB, it looks most like the picture 11.8 pg 167. That chart is also for a very slow market, like Monday's US holiday. Nothing wrong, just have to be careful because range breakouts have a tendency to fail in a slow market.

As an IRB, it looks most like the picture 12.8 pg. 202. This is a type 3 IRB (see page 176-177). The book examples of type 3's usually show a strong trend so that the IRB has a trend to continue or reverse after it breaks the range barrier. In your chart, there is no strong trend to continue/reverse.

Remember this setup. I'm thinking it might work well in a faster market or in context of a prior strong trend then range.

For slow markets, I think a "boomerang" IRB would work better where you fade at the barrier extremes (range continues).

For today's trade management, a re-read of the tipping point chapter could prove useful. I notice something new on every re-read.

Good trading.
 
95 AUD trade.png

I was wondering if you all would have taken this trade or not. I saw this SB sitting right above the average. It came on the AUD/USD news announcement tonight. The reason I skipped it was because it made a large bull move right through that previous range, but it did see a little resistance along the way. It wasn't as bad as the chart in the "unfavorable conditions" chapter that showed a bullish move cut through a range completely uncontested. I thought maybe I should have taken it especially since it used the top of the range for support, but am still trying to figure out the odds of this particular scenario.
 
I was wondering if you all would have taken this trade or not. I saw this SB sitting right above the average. It came on the AUD/USD news announcement tonight. The reason I skipped it was because it made a large bull move right through that previous range, but it did see a little resistance along the way. It wasn't as bad as the chart in the "unfavorable conditions" chapter that showed a bullish move cut through a range completely uncontested. I thought maybe I should have taken it especially since it used the top of the range for support, but am still trying to figure out the odds of this particular scenario.

Yes. On my checklist, it scores a 7 out of 9. The pullback was the 3rd time to the ema and again the ema brought in new bulls. The 1.02 support held. And as you said, the prior SH held. It is always right to have concern about a shock effect run. But I think the 2 prior pullbacks to the ema negated that somewhat. If you were concerned about it, an aggressive tipping pt mgm may be called for.
 
Yes. On my checklist, it scores a 7 out of 9. The pullback was the 3rd time to the ema and again the ema brought in new bulls. The 1.02 support held. And as you said, the prior SH held. It is always right to have concern about a shock effect run. But I think the 2 prior pullbacks to the ema negated that somewhat. If you were concerned about it, an aggressive tipping pt mgm may be called for.

Cool. Thanks a bunch. I was wondering, what's your checklist? Is it different for certain setups?
 
Hi, I only took one trade today. Although the market was moving, it was hard to assess overall pressure. The market changed direction frequently due to news. This was the only setup I found today that I was comfortable with. What did you trade?

1/ DD - The trend here is obvious nd there is no immediate chart resistance to the left (although there definitely is some resistance would I decide to scroll back). The pullback halted in the vicinity of EMA and tested the bull flag pattern that occured a moment ago.

You can see one more DD near the end of the chart - it was a no trade for me because it looked worse then the previous DD and that one already had some troubles getting to the target (little range formed). What is more, the high of the trend is blocky and the 40 number was attacked twice and twice rejected. It's safer to stay on the sidelines.
 

Attachments

  • Obrázek 11.jpg
    Obrázek 11.jpg
    200.8 KB · Views: 237
1/ DD - The trend here is obvious nd there is no immediate chart resistance to the left (although there definitely is some resistance would I decide to scroll back). The pullback halted in the vicinity of EMA and tested the bull flag pattern that occured a moment ago.

I let fear get the better of me and I ended up skipping this trade and the SB opportunity after it. No trades for me today.
 
I let fear get the better of me and I ended up skipping this trade and the SB opportunity after it. No trades for me today.

It almost happened to me as well, I hesitated for quite a long before firing my order, could be about 30 seconds after the break. Sometimes it is challenging to quickly switch from spectator's state of mind into participant's one. Still, being able to stay on sidelines in a market like this is a skill on its own.
 
Hi, I only took one trade today. Although the market was moving, it was hard to assess overall pressure. The market changed direction frequently due to news. This was the only setup I found today that I was comfortable with. What did you trade?

1/ DD - The trend here is obvious nd there is no immediate chart resistance to the left (although there definitely is some resistance would I decide to scroll back). The pullback halted in the vicinity of EMA and tested the bull flag pattern that occured a moment ago.

You can see one more DD near the end of the chart - it was a no trade for me because it looked worse then the previous DD and that one already had some troubles getting to the target (little range formed). What is more, the high of the trend is blocky and the 40 number was attacked twice and twice rejected. It's safer to stay on the sidelines.

This is the same trade that I took today, but I took my profit early for only 4 pip :( Thought it was going to turn around. Overall pressure was up and it formed on top of support so I probably should've stayed in and used the tipping point. I seem to be bad about that, whenever I think a double top is forming I tend to exit. I need to quit doing that, but it's defensible in the case of a forming triple-top.

I saw a setup on GBP/USD but it overlapped with this DD trade on the EUR/USD by a few bars and I missed the entry. GBP/USD had a few big moves today.

Also saw this IRB but missed the entrance. I plan to get a 2nd monitor so I won't have to switch between charts. This trade was also a bit tricky and took some time to evaluate, so who knows if I would've been on my game enough to actually take this. But it serves as an interesting example.

96 GBP.png

This IRB might look sketchy but here's why it had my consideration: Although it seems to have found support, overall pressure is down and there are basically 2 triple tops that price would have to climb through. Instead the IRB uses them as resistance. But what really made me think this would be a valid trade is the fact that it forms right after an opposing countertrend IRB that failed. Right before this box you can see a bullish IRB of the weak variety. I don't think it's valid without more pressure on the barrier, and it's in bearish context so it's invalid, but some people participated in it. It didn't make it 10 pips before the bearish IRB formed. If it breaks south, the countertrend traders just got whipsawed and price is pushed back into the range which would be discouraging to anyone who took a bullish position.

It may be a little aggressive to the eye, but I think the psychology behind it is solid. I don't like that there were only 3 touches on the barrier, but meh, can't have it all I guess.
 
Cool. Thanks a bunch. I was wondering, what's your checklist? Is it different for certain setups?

I have a checklist for each of Volman's setups. I break most of them down by
context, price action, quantify. Some have an extra category -- like the SB has a category to also evaluate the FB.

Then I have a checklist for unfav conditions that I use on all setups.

Sometimes I don't have time to go through each item on the list when a setup builds and breaks fast. But at end of day review, it helps me to be objective instead of prejudiced with hind-sight bias.

I like your example of the IRB in the GBP-USD. I don't think I would have spotted something like that.
 
Hi, I’m new to this forum, just picked up Bob’s book and read the first chapter. I used to trade S&P 500 (full and Emini contracts) back in 2000-2002 using Tradestation, but never done anything with Forex. I have only 2 questions, hopefully nothing too controversial – 1. Can I use Tradestation as a charting and brokerage platform for Bob Volman’s book 2. Did anyone try automating Bob’s trading techniques and if yes, with what results?

Thank you,

Jake

Hi Jake,
I looked into Tradestation but I think I passed because it didn't have 70 tick charts. You can still see some of the formations on the 30 second or 1 minute charts but the 70 tick is the best. My platform (Pathfinder from Fastbrokers) doesn't have a 70 tick, only a 30 tick, so I use ProRealTime for charts and Pathfinder to initiate trades.

I played around with automated trading on a demo account for awhile. Unfortunately I think Volman's method is too subjective for automated trading. It needs the human eye. There's probably a way to automate it but it would be incredibly in-depth and would likely only work for the trending setups if at all.
 
Hi, I’m new to this forum, just picked up Bob’s book and read the first chapter. I used to trade S&P 500 (full and Emini contracts) back in 2000-2002 using Tradestation, but never done anything with Forex. I have only 2 questions, hopefully nothing too controversial – 1. Can I use Tradestation as a charting and brokerage platform for Bob Volman’s book 2. Did anyone try automating Bob’s trading techniques and if yes, with what results?

Thank you,

Jake

Hello Jake, welcome to the thread.

1. It's up to you really but read Chapter 2 because it talks about the tick chart used in his book.

2. You can't automate Bob's method (well) because it requires a lot of technical logic and discretion from the trader. This isn't a 100% mechanical trading method.
 
Hi, these are my trades today.

1/ RB - I had to bail out early for a minor profit, because news time (14:30) was gettin too close.

2/ FB - Probably my first First Break. I got 3 pips slippage.

3/ IRB - A wide range appeared with distinctive double top after a trend. Although the bull/bears fight looks about breakeven, there was a series of lower high all the way from the top barrier. I balied out after that 3rd bottom under the barrier formed.

4/ Possible IRB to the upside? I wasn't sure if there was enough bullish pressure to justify the trade. I don't think there was.
 

Attachments

  • y2.jpg
    y2.jpg
    195.7 KB · Views: 242
  • y1.jpg
    y1.jpg
    153.2 KB · Views: 275
1. Can I use Tradestation as a charting and brokerage platform for Bob Volman’s book
A fellow trader and myself looked at the EURUSD tick charts on TS.
Here's what we found:

A 35 tick chart on TS was more comparable to the 70 tick chart on a different data feed.
A question posed to TS about the difference got this answer:
"Our charting software is not designed to display bids and offers; only trades… Being there is no actual 'trading' on the forex market, we generate the trades internally based on the 'bids' we receive from our provider. We also have forex symbols that are based on the 'ask' price (EURUSD.A). "
"data for EURUSD is provided to us by Currenex in 5-decimal format"

TS versus Prorealtick chart:
For an active, fast-moving period of 1 hr and 50 minutes:
Prorealtime 70tick chart printed 234 bars to TradeStation's 161 (gives ratio of 1.45:1).

In the full 24hour day (midnight to midnight GMT), prorealtime printed 1868 bars to TradeStation's 1129 (gives ratio of 1.65:1).

Prorealtick charts more cleanly with smoother bottoms and tops. Tradestation looks more jagged around the edges. This is probably due to the 5 decimal format used by TS.
 
Did anybody else try this trade? I lost 3 pips. I'm not sure if it was a bad read or not. The 2nd box might work out, but I didn't take it. For the break of the first BB, the pressure was slightly more bullish, but maybe it was too even at this point to be trading. It looked like I had a higher double bottom and some dojis before the break of the box. I didn't think those tops would pose too much of a threat to a BB with bullish pressure on its side. I skipped the 2nd box since it was 1 pip lower. While there was obvious buying interest there from dip buyers, I couldn't tell which way the pressure was leaning for sure.

910 trade.png
 
I take it back, that was dumb, wasn't it? Lol.

Considering how much the market was moving today.. yeah :) I took a BB early today and that was about it, lost 7 pips. Mondays with no news.. is it even worth it spending time before the computer on a day like this?
 
is it even worth it spending time before the computer on a day like this?

Absolutely. But maybe I am only saying that because I made some pip today. :cheesy:

The problem is that you don't know for certain that nothing will happen on days likes these. Opportunities to trade may or may not show up regardless of whether there are any scheduled releases of economic news. It's possible that some unexpected news item may move the market.

I understand how you feel though. I definitely skip bank holidays. I have the urge to skip trading on days like these too because I get really bored. But you just never know what is going to happen. If the market happens to be too slow, maybe you could reread parts of Volman's book or study some charts from previous days while keeping an eye on the market. I get distracted at times but I try to do some studying so the trading session isn't wasted.
 

Attachments

  • USD Spot1-3.png
    USD Spot1-3.png
    11.7 KB · Views: 227
Did anybody else try this trade? I lost 3 pips. I'm not sure if it was a bad read or not. The 2nd box might work out, but I didn't take it. For the break of the first BB, the pressure was slightly more bullish, but maybe it was too even at this point to be trading. It looked like I had a higher double bottom and some dojis before the break of the box. I didn't think those tops would pose too much of a threat to a BB with bullish pressure on its side. I skipped the 2nd box since it was 1 pip lower. While there was obvious buying interest there from dip buyers, I couldn't tell which way the pressure was leaning for sure.

View attachment 144568

I was looking at that first setup too but I felt that there was too much resistance above for a 10 pip target. I thought that level of resistance was more significant because of the slow market.
 

Attachments

  • USD Spot2-1.png
    USD Spot2-1.png
    12.9 KB · Views: 224
Top