You are using an out of date browser. It may not display this or other websites correctly.
You should upgrade or use an alternative browser.
You should upgrade or use an alternative browser.
thelastseven
Newbie
- Messages
- 4
- Likes
- 0
Hello,
I think it has multiple support below to break to be a good IRB. It can be traded by the good bullish pressure but I think it should not counted as IRB. IRB in this case should in the top of the range but it was in the middle of the range. Not enough room. Just my opinion
Regrads,
V
I think it has multiple support below to break to be a good IRB. It can be traded by the good bullish pressure but I think it should not counted as IRB. IRB in this case should in the top of the range but it was in the middle of the range. Not enough room. Just my opinion
Regrads,
V
BLS
Established member
- Messages
- 642
- Likes
- 229
Week 39 charts from Volman:
https://www.dropbox.com/sh/1amxmi9af0fk6ej/VA5_ZrjQF1
https://www.dropbox.com/sh/1amxmi9af0fk6ej/VA5_ZrjQF1
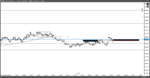
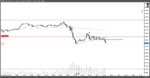
Hello,
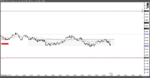
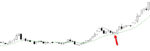
Another short, a range break. I felt that the bulls had failed at the top of the range, making lower highs, so when it went to test the bottom I went short. Of course as I type it appears to be falling shy of the round number target, so out for 10.
Another short, a range break. I felt that the bulls had failed at the top of the range, making lower highs, so when it went to test the bottom I went short. Of course as I type it appears to be falling shy of the round number target, so out for 10.
Attachments
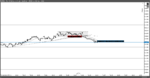
Hello,
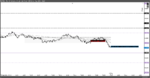
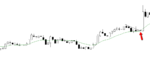
Next trade was a short, slightly against the short term trend, I felt that the bulls needed to make a new higher high, once they were unable to do so, it meant that a test back to the 60 level was next in line for the bears, so after the bull failure, the 60 level break and the trend line break I entered short. Exited at 50 level.
Next trade was a short, slightly against the short term trend, I felt that the bulls needed to make a new higher high, once they were unable to do so, it meant that a test back to the 60 level was next in line for the bears, so after the bull failure, the 60 level break and the trend line break I entered short. Exited at 50 level.
Attachments
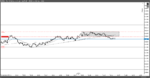
Hello,
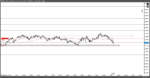
This long trade did not show follow through, I probably should not trade into the lunch hours. I felt that it was an IRB, and I was looking to target the top of the range, but not to be. After a nasty drop after my entry I was lucky to get back to break even, then the bulls failed at the 60 level.
This long trade did not show follow through, I probably should not trade into the lunch hours. I felt that it was an IRB, and I was looking to target the top of the range, but not to be. After a nasty drop after my entry I was lucky to get back to break even, then the bulls failed at the 60 level.
Attachments
PipMonster24
Junior member
- Messages
- 36
- Likes
- 7
@thedawgee
Nice trading and thanks for sharing. (the rest of my post refers to the trades you took today)
Your first trade: I was thinking long too where you entered but declined the trade. For me it seemed a little aggressive considering the market was still making lower highs and lower lows. Still I was tempted since it's not uncommon for the UK open to reverse the direction of the Asian session. Bob often points out bulls/bears keeping the pressure up/down after the London open. This is something I struggle with. I look for it and often read the pressure correctly but I either don't trade it (second guess myself/lack of confidence) or I trade it incorrectly thinking it's just a pullback and the original trend will resume. Part of the difficulty I have is just going off of a relatively small amount of price action like 30 minutes after the UK open.
Your 2nd trade: Did you enter again while your 1st trade was still open? I took the same trade but without the same success you had. After the PA reached the 60 level it pulled back in bouncy fashion rather than forming an adverse block. For this reason I decided to allow it a pullback to support...support was too deep for my stop. Great job exiting when you did. When you took the 2nd trade did you only have the 60 level in mind as your target?
Your 3rd trade: Great trade. I was thinking of shorting that as well but chickened out. My thinking at the time was about all the other times I've been stung on similar trades. Why does the mind remember bad things better than good things? Grrrr 🙁 Had I taken it I would have probably exited at the 00 level as well since I've learned it's always good not too overstay your welcome when going counter trend.
Your 4th trade: I can see how you would want to give it a shot. I was only half focused on the chart because I wanted to see price get back to the 60 level and then see how things developed from there.
Again good trading. Looking at your trades reminded that on days like today, the day before big news like the unemployment rate & non-farm, the market doesn't move much in anticipation of the news and as such it's often best to shorten up your target. I've had many bad trading days that could have been good trading days if only my targets were less.
Hello,
Thank you pipmonster for taking the time to have a look at my charts.
My first trade was based upon the failure of the bears to do what (I believed) they should have done, ie -break beneath and stay beneath.
Second trade was entered whilst the first was still open, (generally not recommended). It was with the 60 level target, after the bears failed to make a new low. Third trade could have perforated the 50 level but did not (immediately) so I bailed. I was hoping it would have tested the bottom of the range and 40 level, but chickened out and did not want to see it come back against, so I exited at the 50 level.
My entries can be quite aggressive at times, I do have a fear of missing out, and I do get bored if I do not trade this way. I have had to develop a contrarian mindset, expecting most breaks to fail. There are also some other factors in my decisions that are not part of Bob's method. He recommends to be far more conservative than I am. I believe that if you look for it there will always be a reason for not entering, so I need to see failure of one side before I enter in the other direction.
Again, thank you for taking your time to look at the charts.
BLS
Established member
- Messages
- 642
- Likes
- 229
Week 40 charts from Volman:
https://www.dropbox.com/sh/1amxmi9af0fk6ej/VA5_ZrjQF1
https://www.dropbox.com/sh/1amxmi9af0fk6ej/VA5_ZrjQF1
PaddyMcTaff
Junior member
- Messages
- 39
- Likes
- 4
Hi Guys,
I got Bob's original book a long time ago but after reading it and learning a ton, didn't pursue his methods specifically. However after getting the second one that approach fits in with how I see things now alot better, especially the Pullbacks which is what I have gradually moved towards focusing predominantly on anyway.
I trade the daily and 12 hour charts due to time restrictions and watch a bunch of forex markets which I know is different to most others in this thread, but I dont see it as being any different as PA is PA right.. If its ok I will post some set ups etc from live and sim trading and would welcome feedback.
I will be focusing on pullbacks pretty much exclusively as want to learn them inside out before looking at any of the other set ups. Entry criteria is as follows:
-Clear trend or start of new trend - breakout/pullback
-Reach 20MA & be trading away from it
-Technical test of S/R or pattern line
-Signal bar has tension and strong close (neutral is ok sometimes)
-Most important consideration is the conditions over and above anything else - trend, lack of obstacles, weakness vs dominance
-Pullback should be orderly and travel almost reluctantly to the MA - no power bars that exceed average span
-Should also be a favourable angle - not steep
-Want to see squeeze and tension with signal bar pushing up against or just through the pattern line
-Trade needs to be super obvious in one glance
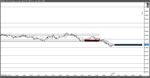
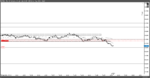
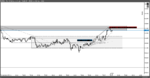
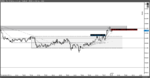
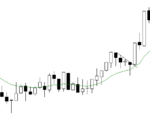
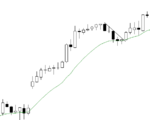
Some A+ examples on the longer timeframes:
I got Bob's original book a long time ago but after reading it and learning a ton, didn't pursue his methods specifically. However after getting the second one that approach fits in with how I see things now alot better, especially the Pullbacks which is what I have gradually moved towards focusing predominantly on anyway.
I trade the daily and 12 hour charts due to time restrictions and watch a bunch of forex markets which I know is different to most others in this thread, but I dont see it as being any different as PA is PA right.. If its ok I will post some set ups etc from live and sim trading and would welcome feedback.
I will be focusing on pullbacks pretty much exclusively as want to learn them inside out before looking at any of the other set ups. Entry criteria is as follows:
-Clear trend or start of new trend - breakout/pullback
-Reach 20MA & be trading away from it
-Technical test of S/R or pattern line
-Signal bar has tension and strong close (neutral is ok sometimes)
-Most important consideration is the conditions over and above anything else - trend, lack of obstacles, weakness vs dominance
-Pullback should be orderly and travel almost reluctantly to the MA - no power bars that exceed average span
-Should also be a favourable angle - not steep
-Want to see squeeze and tension with signal bar pushing up against or just through the pattern line
-Trade needs to be super obvious in one glance
Some A+ examples on the longer timeframes:
Attachments
PaddyMcTaff
Junior member
- Messages
- 39
- Likes
- 4
Also - Many thanks to BLS and especially Bob for continuing to share the charts over all this time
PipMonster24
Junior member
- Messages
- 36
- Likes
- 7
@PaddyMcTaff
You're right, PA is PA and if you hadn't mentioned that you trade the daily and 12hr time frame then I would have had no idea that the charts you attached were higher time frame charts.
Nice charts. It's nice to see someone applying the techniques of BV's 2nd book to higher time frames.
I noticed you don't have any horizontal lines marking round numbers (magnets) on your charts. For the daily and 12 hr time frame I would think horizontal lines marking at least the 00 levels would be appropriate. Personally it would drive me crazy not to have them.
Good stuff. Look forward to seeing more.
I would like to know the name of the market and the time frame on every chart so I can look it up and work on it. very important for me to be able to work a chart myself. and in this case I have no idea what I am looking at. although the charts sort of look good. but then no idea on the losers. easy to find winners after the fact.
I would greatly appreciate if you can let us know what the market and time frame was on all the charts.
thank you
Jingles
I would greatly appreciate if you can let us know what the market and time frame was on all the charts.
thank you
Jingles
cha-ching
Active member
- Messages
- 148
- Likes
- 9
Anybody trading USDCAD?
The pair has been much more volatile than before, with average (median) daily range of more than 100 pips every month this year, except for July (98 pips), higher than both USDJPY and AUDUSD. If you can get a good spread it may be worthwhile trading.
I remember somebody mentioned it in the forum a while ago but I couldn't find it. Please share your experience if you have ever traded it. Does it behave similarly to EURUSD this year? Volatile enough during US mornings?
Thanks,
Cha-ching
BLS
Established member
- Messages
- 642
- Likes
- 229
Week 41 charts from Volman:
https://www.dropbox.com/sh/1amxmi9af0fk6ej/VA5_ZrjQF1
https://www.dropbox.com/sh/1amxmi9af0fk6ej/VA5_ZrjQF1
PipMonster24
Junior member
- Messages
- 36
- Likes
- 7
The pair has been much more volatile than before, with average (median) daily range of more than 100 pips every month this year, except for July (98 pips), higher than both USDJPY and AUDUSD. If you can get a good spread it may be worthwhile trading.
I remember somebody mentioned it in the forum a while ago but I couldn't find it. Please share your experience if you have ever traded it. Does it behave similarly to EURUSD this year? Volatile enough during US mornings?
Thanks,
Cha-ching
I don't trade the pair but considering the lack of movement in the USDJPY I'm tempted to jump ship.
I'm curious, what do you use to keep track of average daily range? Just an indicator or is there some website that tracks that info.?
cha-ching
Active member
- Messages
- 148
- Likes
- 9
I don't trade the pair but considering the lack of movement in the USDJPY I'm tempted to jump ship.
I'm curious, what do you use to keep track of average daily range? Just an indicator or is there some website that tracks that info.?
I use Tickstory Lite to download tick data from Dukascopy, then export daily bid candle prices (using New York 5pm price as close price) to spreadsheets. Then I have my own spreadsheet to calculate the daily price range and median range by month.
If you just want to take a brief look at recent daily ranges, go to:
http://www.forexfactory.com/market.php
Pick a pair, choose Daily, and move your mouse around in the chart. It then tells you the OHLC prices as well as the range. For example, today USDCAD's range is 109 pips, even though it's US Columbus Day and Canadian Thanksgiving Day.
Attachments
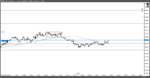
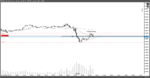
Hello,
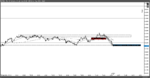
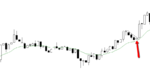
I have been reading Bob's other book, for the 5 min charts, and although it requires a frustrating level of patience, it has a very good strike rate. I refer to the 5 min charts when the market gets choppy. Here is the only trade that I entered today. There was some hesitation on my behalf due to the possible obstacles to the left but it managed to get to target. It appeared that the bull break against the earlier bearish momentum was failing at the EMA, 50 level, and at the 50% pullback area, so I entered a short.
I have been reading Bob's other book, for the 5 min charts, and although it requires a frustrating level of patience, it has a very good strike rate. I refer to the 5 min charts when the market gets choppy. Here is the only trade that I entered today. There was some hesitation on my behalf due to the possible obstacles to the left but it managed to get to target. It appeared that the bull break against the earlier bearish momentum was failing at the EMA, 50 level, and at the 50% pullback area, so I entered a short.
Attachments
Similar threads
- Replies
- 15
- Views
- 9K