Bob Volman Price Action Scalping

View attachment 143258

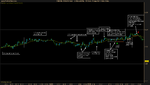
I've only seen one opportunity so far today and I skipped it. That first bearish push cut through the bottom of the range without running into any resistance, so I skipped the SB setup at 7:54 on the chart. This was a terrible breakout because there was mysteriously no tension at all behind it, and it died out. There was a DD right in the average that I knew to skip because it had also not yet pulled back 40%.

I watched that BB setup but didn't take it. I wish I had, but I've had trouble with the smaller BBs. I think in this case it would be an ARB? This one shows excellent tension and was clearly bullish. Even had a retest of the breakout range, providing a 2nd chance to get in.

The 2nd box that I drew was a possible BB developing, however I didn't see the level of tension that I wanted so I skipped it. Seeing that price would need to clear 2 tops, I wanted to see a little more bullish tension before the break.

For that first BB, I would not trade it as a BB since the market wasn't really trending at the point. I would hesitate to trade it as a clustering ARB since there was a solid upper barrier line for the range that it broke out of (the clustering occurs because there is some uncertainty as to where the break actually occurred).
 
I kept thinking that many traders would stay on the sidelines until FOMC Meeting Minutes were released so I did not think I would have gotten much double pressure.

The second skipped setup was a rather weak BB setup.

I thought the same thing, although it has been printing ticks at a fairly decent pace today considering.
 
For that first BB, I would not trade it as a BB since the market wasn't really trending at the point. I would hesitate to trade it as a clustering ARB since there was a solid upper barrier line for the range that it broke out of (the clustering occurs because there is some uncertainty as to where the break actually occurred).

True, that made me a little hesitant and probably stopped me from taking it at the time, but looking back, here's my analysis:


Pros: Only resistance is 1 top. If I saw 2 I'd avoid it but a BB is one of the stronger setups. Check out Figure 13.10 in the ARB chapter. It is somewhat similar.
-Strong bullish tension within the box
-3 significant higher lows in the range below
-Comes after a trap range break that tricked a lot of bears
-the BB formed on top of 3 tops for support
-A BB can form anywhere on the chart
-The BB is a retest and confirmation of support above a significant round number (50 level)
-Formed on top of an RB, although that RB on its own is of poor quality.
-Within the previous range there are 2, maybe even 3 inverted head and shoulders patterns

Cons:
-1 top resistance
-Not a lot of blocky action below to prevent price from going back into the range. A topside break would give it support from the box and the 3 tops below that. It's just not a big wall of horizontal support like in an RB.


I re-read the BB chapter a couple days ago. I know it says you can take a BB basically anywhere in the chart, but so far I've only been comfortable with ones in a trending market. I'm not sure I have a good handle on BB's in a non-trending market just yet. Still, I felt this trade had pretty good odds. I could be wrong.

The pressure is on your side but that doesn't mean that the 60 level will break so easily. It did here but it may not do so on average. In my more recent emails with Bob, he advised to skip trading BB's into a 20-level in a non-trending/ranging market because the 20-levels were more likely to hold than to break. But he also added that trading BB's like that may prove profitable in the long run though, so I guess it's up to you. I'm just uncomfortable trading BB's like that.
 
The pressure is on your side but that doesn't mean that the 60 level will break so easily. It did here but it may not do so on average. In my more recent emails with Bob, he advised to skip trading BB's into a 20-level in a non-trending/ranging market because the 20-levels were more likely to hold than to break. But he also added that trading BB's like that may prove profitable in the long run though, so I guess it's up to you. I'm just uncomfortable trading BB's like that.

Hmm, interesting.

Also just saw prices charge right through a triple top from a low, and then drop all the way through the previous range without really acknowledging hardly any of the potential resistance from the previous range. I wonder why it keeps doing that today. FOMC days are weird.
 
The pressure is on your side but that doesn't mean that the 60 level will break so easily. It did here but it may not do so on average. In my more recent emails with Bob, he advised to skip trading BB's into a 20-level in a non-trending/ranging market because the 20-levels were more likely to hold than to break. But he also added that trading BB's like that may prove profitable in the long run though, so I guess it's up to you. I'm just uncomfortable trading BB's like that.
Hi, do you think it would be possible to forward me your conversations with Bob for educational purposes? The book itself contains a lot of information, but some notes for the more recent market environment would be most useful :)
 
Three trades from today: (entry in blue, exit in pink). Note that this is EUR/USD futures (6E).

1. SB. Actually, I was anticipating an SB but got in before a second leg occured. The signal bar just looked good.

2. DD (or SB?). I scratched at even. This is a common problem I have. Nerves. I should have noted the higher low just before exiting and the subsequent double-bottom. I get impatient and often scratch early. I know Bob says the ability to hold is what separates the men from the boys.

chart_20120822_1.jpg

3. SB. Sloppy entry but it worked out. I don't usually trade around FOMC time, but the action was so abrupt at the EMA that I figured I'd go for it.

I'm tempted to start swinging a partial position; such a nice run after exiting. Does anyone else do that?

chart_20120822_2.jpg
 
Last edited:
Today was a pretty interesting day for me, looks like the market finally started running and ripping.

I am still very questionable about the whole 10 pip take profit target. Today I had a nice IRB setup in the last half hour of trading. At 11:31 am EST I got in short at 1.2581. Clearly there was support at 1.2575, but I religiously honored the 10 point target. Looking back at it, clearly I would have been better off covering at the support level because the market hesitated and chopped around before throwing everyone's stops out, and that is usually what it does in these cases. I don't know why it makes sense to magically wait for it to burn through such a clear line of support even though it could happen, after all the overall trend of today was up.
 
Hi Tony,

Last night I started re-reading Volman's chapter on unfavorable conditions. I think it's a good one for the point you raise.

With support directly below your entry, I suppose that must be considered an aggressive trade, so the struggle seems expected. I think part of the point of 10p potential is identifying entries that do not have significant hurdles to the target.

I had only one trade today, but it breezed right to the target. Seems to me that that those are the entries we should be seeking. I have no issue with scratching for a small gain if things turn sour, but if we don't have a target, and if we don't choose setups with a high probability of getting there, we could develop a hair trigger on all our exits. Personally, I'm really starting to appreciate the value of trade selection with the target in mind.

John

Today was a pretty interesting day for me, looks like the market finally started running and ripping.

I am still very questionable about the whole 10 pip take profit target. Today I had a nice IRB setup in the last half hour of trading. At 11:31 am EST I got in short at 1.2581. Clearly there was support at 1.2575, but I religiously honored the 10 point target. Looking back at it, clearly I would have been better off covering at the support level because the market hesitated and chopped around before throwing everyone's stops out, and that is usually what it does in these cases. I don't know why it makes sense to magically wait for it to burn through such a clear line of support even though it could happen, after all the overall trend of today was up.
 
Hi Tony,

Last night I started re-reading Volman's chapter on unfavorable conditions. I think it's a good one for the point you raise.

With support directly below your entry, I suppose that must be considered an aggressive trade, so the struggle seems expected. I think part of the point of 10p potential is identifying entries that do not have significant hurdles to the target.

John

I did a bit more researching myself and on page 181, Fig. 12.2 we see an IRB that had similar theme to my trade. This one went right through the range, but I am not 100% sure that if we take the moement of the break to the bottom that we'd get 10 pips exactly. I looked at a few more charts and it so seemed there too. But then again, its hard to tell from printouts exactly.

I think that if I take a setup like this in the future I should take it but just take profit at the support line. That would have been a solid setup and you can't always expect the market to give you a 10 pip run (esp. this past month with the Vix sitting at multi-year lows)
 
Hi, today I took/should've taken these trades:

1/ Nice IRB. I waited to see one more doji below the IRB line which would give me considerably more economical stop, but that was a mistake, because the original stop was still ok and provided bigger odds.

2/ Trading this DD, I had to use logic instead of rules. One of the dojis is 4 pip high, which is way too much to consider it doji - however, if the candle was just one pip smaller, it would be a near-perfect setup. So my thinking was - does the extra pip really invalidate an otherwise valid setup? I traded it as a DD.

3/ A BB/DD. If you guys have any comments on this, I'd appreciate it, because I wasn't sure about that trade at the time I took it, although I like it from hindsight :)
 

Attachments

  • irb.jpg
    irb.jpg
    132.4 KB · Views: 307
  • dd.jpg
    dd.jpg
    142.6 KB · Views: 251
824 BB.png

I just saw this BB trade. I didn't take it because of that resistance within the ellipse, but overall conditions pointed to a potential breakout. I am still learning to read the overall picture and trying to figure out how much resistance is too much, so I am being very cautious right now. This level of resistance would be a problem for a DD or SB, but it shouldn't be too much for a BB. It comes after a bunch of higher bottoms, 7 equal touches of the barrier before the break, and that BB should pretty much illustrate the bears being pushed back into the corner and then jumping ship. All in all, there were no bearish signs other than the ellipse, but that should be weak resistance to a BB.

Today seemed slow to me. I saw an easy IRB break on the GBP/USD about 15 min after the US session started, and another IRB that wasn't quite as pretty on the EUR/USD 30 min in. Enough opportunities for a day, but I am still not taking IRBs just yet, although things are starting to click in that area.
 
Hi, today I took/should've taken these trades:

1/ Nice IRB. I waited to see one more doji below the IRB line which would give me considerably more economical stop, but that was a mistake, because the original stop was still ok and provided bigger odds.

2/ Trading this DD, I had to use logic instead of rules. One of the dojis is 4 pip high, which is way too much to consider it doji - however, if the candle was just one pip smaller, it would be a near-perfect setup. So my thinking was - does the extra pip really invalidate an otherwise valid setup? I traded it as a DD.

3/ A BB/DD. If you guys have any comments on this, I'd appreciate it, because I wasn't sure about that trade at the time I took it, although I like it from hindsight :)

I would've taken that 2nd trade too. It looked very close to one of the book examples. Unfortunately I didn't get to trade today, had to move, but I did check over the charts last night.

I'm not sure how I feel about the 3rd one. It looks exactly like something that's happening on the chart right now actually. I skipped situations like this because I don't like that wall of resistance directly to the left (5-6 equal touches of a support line that ended up failing). But I do like that it formed on top of a previous setup/support, which is a good sign. I just feel 50/50 about it since that resistance is blocky, I haven't seen situations like this enough to know if the BB can break through it. I'm still trying to gauge how strong a BB is, so it may be valid. If it broke through once, came back down into the box and built up for a 2nd attempt, I'd take it for sure.
 
This looked to me like a valid countertrend opportunity. I don't usually take those, but this one looked good for several reasons:

1. The biggest reason: If there is a downward break, there is absolutely no resistance for more than 10 pip.
2. We can imagine that if that support breaks, most people holding positions through the vertical move will take their profit
3. That bullish breakout was vertical. Most vertical moves get countered or retrace most of the way.

There was very strong double-pressure working here. If that support failed, there would be plenty of resistance on the chart to prevent prices from charging back up right away.

View attachment 143422
 
Hi fellow scalpers, I've got a question and an idea today.

Does anybody here know something more about the impact of colours we use for charts? We all use different colours and I've been wondering what are the best coulours to use. I'm sure some trading literature or article has covered this topic from a scientific point of view, so if anobody would know where should I search, let me know :)

Today I've been going through charts for the last week and I almost couldn't believe how many beautiful setups were there that I didn't pick live and I just thought that the thing we have to learn is quite simple - take the obviously good setups, don't take the obviously bad setups. This should provide good results. Then there is of course they grey zone of setups that might or might not be valid, but the core of our results lies in taking obviously valid trades and declining obviously invalid trades. And this is mostly a visual thing. So, I think a great idea would be to scan all the valid setups from the book + add some of your own (that you're 100% certain about), print them, and review them daily, perhaps even during the trading session.

What do you think? Perhaps somebody is already practicing that? :)

Oh, and one more thing, I think we're all breaking the licence agreement with ProRealTime by posting the charts here :D
 
take the obviously good setup

Depends on what you mean by "good setup". As Volman says in his unfav conditions chapter, you can have a picture perfect setup but if the conditions are bad, you shouldn't take it. He also says that you can't judge based on whether one setup is "better" than another. For example, perhaps the squeeze in an IRB doesn't have the last 2 bars as 2 dojis. That would be ideal. So when you don't have it, do you pass? If you start second-guessing then you are not playing probabilities. See his comment on page 176 that all valid setups are equal.

Not everyone agrees with Volman's approach. I do know trading firms who add more risk to their "A" trade setups versus their "C" trade setups.

As for colors, I haven't read a trading article. But I get an emotional reaction to seeing a lot of red on the screen so I don't use the red color. I read somewhere that red stimulates you which is why restaurants use red - to stimulate your appetite.
 
So, I think a great idea would be to scan all the valid setups from the book + add some of your own (that you're 100% certain about), print them, and review them daily, perhaps even during the trading session.

I sometimes look up the setup in the book and try to match my chart or a posted chart to one from the book. For example, I thought your recent IRB setup shared many characteristics to Figure 12.5 on page 192. The book's chart pullback made a DB when forming the IRB and so did yours. Sometimes I'll annotate my chart with the figure that it is most similar to in the book.
 
As for colors, I haven't read a trading article. But I get an emotional reaction to seeing a lot of red on the screen so I don't use the red color. I read somewhere that red stimulates you which is why restaurants use red - to stimulate your appetite.

I had not thought about this but I am curious about the effect of the color red. I will try excluding the color red from my charts now on.

I sometimes look up the setup in the book and try to match my chart or a posted chart to one from the book. For example, I thought your recent IRB setup shared many characteristics to Figure 12.5 on page 192. The book's chart pullback made a DB when forming the IRB and so did yours. Sometimes I'll annotate my chart with the figure that it is most similar to in the book.

It's a good idea to do when you are starting out with Bob's method. There are classic setups that you should familiarize yourself with, like 11.6 and 11.9 because I see them appear on a regular basis (though not lately but that might just be an issue with low volume). I used to do this but I'm not sure it's something one should do in the long term. It's certainly a good way to train your eyes to spot setups but I think a lot of the times valid setups (in favorable conditions) are going to present themselves in many different ways not covered in the book. I've found that doing this will sometimes lead me to focus too much on the setup and not enough on the overall price action. I feel that I focus on the setups in the book too much and end up skipping a good number of valid trades because they don't look like anything from the boot. But that's just my personal experience.

I guess what I'm trying to get at it is to not over do it, that you have to remember the most important thing to focus on is overall price action.
 
like 11.6 and 11.9 because I see them appear on a regular basis.
... the most important thing to focus on is overall price action.
I see 11.6 a lot. It takes a lot of patience or else you get in too soon on an IRB.
I did a review and discovered I did focus a little too much on the setups for ARBs. I had about a 55% success rate with them and wondered why. I discovered I was ignoring or not seeing bottoming action that showed bad context for an ARB as a continuation of a bear.
 
Major snooze-fest today with a bank holiday in Britain and little economic news. Anyone have better luck today? I only took one trade today that I bailed out on for a tiny profit.
 

Attachments

  • USD Spot.png
    USD Spot.png
    18 KB · Views: 1,806
Top