Hey guys,
Haven't been posting anything either mostly cos I'm kinda busy and always out in the evening and forget to post here when I come back.
Am having the biggest streak of losers that I've ever had so far but I'm much less stressed about it. I just realized that I was far from being proficient at this for now so I just need to relax and keep at it.
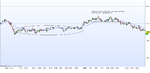
Here are some charts from Wednesday on, I'd appreciate any comments (the least one is Friday, just moments ago).
Edit: BLS, just saw your charts. I'm kinda surprised you took the trade on your last chart (n.3 in my charts), that bearish bar was pretty long, but regarding overall conditions it was probably the highest odds setup I saw this week.
The other trades are kinda similar to what I'm doing, I'm just too lazy to dig in and find out if I took the exact same ones. I think market conditions are kinda hard right now. There seem to be at least 2-3 Mm/Ww ranges or BBs per day but a lot of these breaks fail.
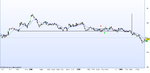
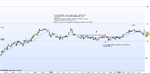
Chart 1: I agree with BLS that this trade is valid, albeit of debatable quality. When price drops from the top to the bottom of a range in the way it did here (from around 20 to around 10) then proceeds to make somewhat of a wedge formation (diagonal squeeze into signal line) without a significant bounce it may not catch as much follow through. One could argue that there would be more traders willing to buy on this break than sell. But what I have noticed is that once the market has a few more pushes away from the possible signal line, preferably with false breaks, many more traders will be caught long if and when the market finally succumbs to bearish pressure. I guess what I'm really trying to say is that I'm learning that one can be quite a bit more patient with these barrier trades, waiting till that moment when the pressure/predicament of those trapped becomes unbearable and those on the sidelines can't help but join in.
The benefit of waiting for superior set-ups to evolve as one is learning is that it really does keep you out of a LOT of losing trades that in hindsight were clearly invalid, or of debatable quality at best. It also often means you are not entering prematurely and risking being stopped out of a potential winning trade before it even takes off. As we know, with this method of trading timing is everything. And yes, it will mean you miss some moves that head off without you onboard. However, as the aim of the game is to develop confidence in your ability to read price action and execute your edge, I am starting to believe that the sidelines is the best place to be if doubtful at all. At least when not in position you are learning from watching the market objectively, with the hope of learning and recognising more and more non-debatable set-ups.
I also believe that you need 2 things to take a trade: a valid set-up, and inner conviction or intuitive support. Yes this is entering the realm of the subjective, but after all, we are dealing with a discretionary system whose success relies on the skill of the executioner; skill that can only be built up over countless hours of screen time, watching and observing how markets move. Over this time one develops an intuitive capacity for pattern recognition that cannot always be explained, however hard the rational mind may try.
Having said all that, one needs to place trades to get experience. So it's a bit of a balancing act, knowing when to show prudence or aggression; to not fall into complacency when observing, not wanting to make a 'mistake', and thereby missing perfectly valid trades, and not swinging the other way, and taking any 'seemingly valid' set-up that comes along, or trading on tilt after a loss or two.
It's an interesting game this....GOD I CAN WAFFLE....sorry. I think I'm writing this more for my own benefit than anyone else's - to get my own thoughts straight. Anyone who's reading this - thanks for entertaining me...
I guess I had somewhat of a revelatory experience this week - seeing trading from a different point of view. Up until recently I have struggled with the notion of being a trader because I didn't see any intrinsic worth in the act of trading itself; you know, just doing something for money that doesn't help anyone or contribute anything to society. However, I am beginning to see it as a real vehicle for self-development. The self-awareness one must have at all times to be a successful trader is extreme. The opportunity one has to develop empathy and intuition too is high. Then there is the psychological side of things and the interest in human behaviour (which I've always had). All this adds up to not only becoming a better trader, but also a better person, and what goal is more worthy.
Right, back to the charts, hahaha
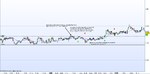
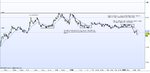
Chart 2: I actually took the initial break of the ARB line you indicated - ouch! which hurt. And yes, I was concerned about the cluster BLS mentioned but it didn't seem as outspoken as the build-up below it, plus the trend was up. Anyway, it was premature on my part. As for your trade, I think you should have at least waited for a break of the ARB line.
The second trade I also took and believe it is definitely valid - being a Mm pattern and the second attempt to move higher. But yes, I believe you trailed your stop too aggressively. I actually kept mine below the ARB line you indicated to allow for a test of the barrier. Luckily it paid off. Will be interesting to see if Bob took this trade and if so how he managed it. However, I taking more and more heed to his advice of giving trades more room to move than not enough.
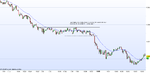
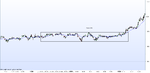
Chart 3: I think BLS's way of trading this move was valid and I also believe your potential trade was even better. As for the stop, I probably would have given it a couple of extra pips above the barrier depicted to allow for a ceiling test of the last arch, which Bob indicates is all too common.
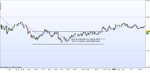
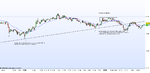
Chart 4: I agree it was best to skip this trade. The market could easily have dropped back down to test the strength of the prior double bottom. I keep reminding myself of Bob's stress on the highest probability trades stemming from proper build-up - meaning the market usually moves in step-wise fashion, in this case this would mean testing the support to the left to some degree before moving on. Of course one can argue this reflects potential strength, but it can often result in a quick stop out.
Chart 5: I think this example is quite similar to your first chart, except this one (as BLS points out) is entering right into potential 20 level support and also into the support of a bull flag break out to the left. Best give it more time to build up.