Beyond Price Action

This week (10th June) we have high impact news that will affect price action

1) Wednesday CPI at 8:30 EST
2) Thursday Initial Jobless 8:30 EST & FOMC Statement 2:00 EST
with FOMC Press Conference 2:30 EST

Tier 1 Institutions have already positioned themselves and are trading around "core
positions". Commercial HFT and Retail will have their own process in place, with
some waiting for various time periods, then placing bets based on what they see the
big players doing. None of this is much of a secret

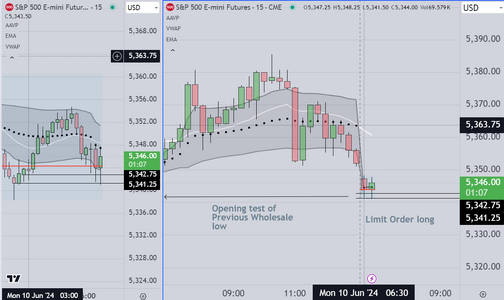
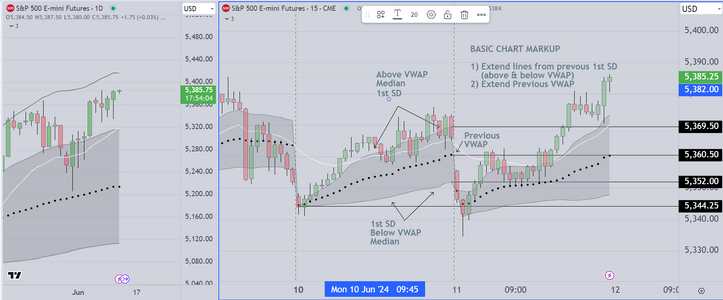
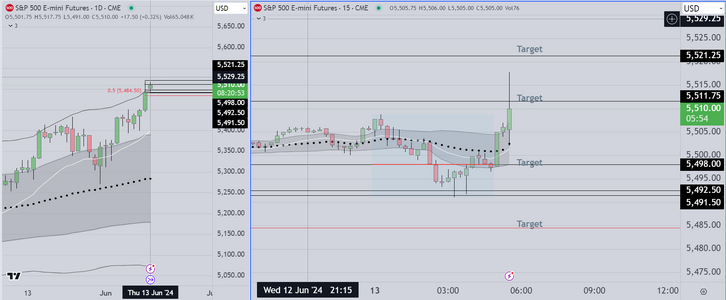
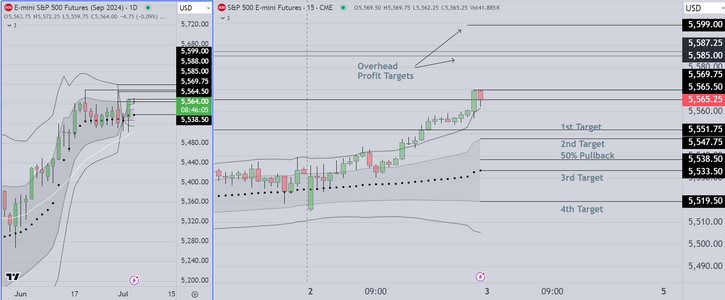
Typically we anticipate trading range activity, starting today, and will be marking high & low closes,
entering on retests. This is standard, and uses the basic VWAP framework. Absent a strong breakout,
we will likely trade using limit orders for both entry and exits.

Depending on the size of the range, we suggest retail traders stand aside until this plays out
beginning to trade again Friday 14th (using Market Orders)

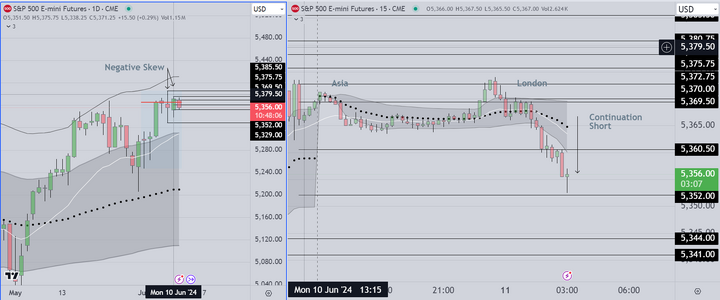
Since economic conditions have not changed, detailed examination of price action surrounding
the previous FOMC event is a critical part of our process.

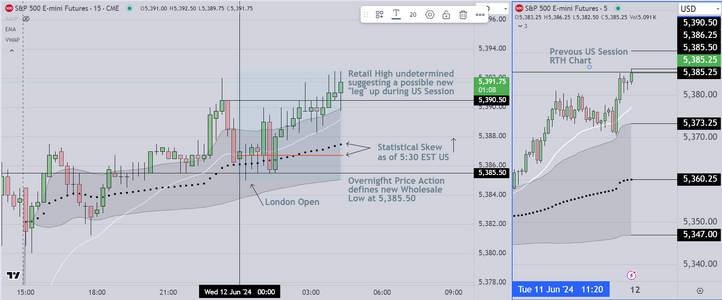
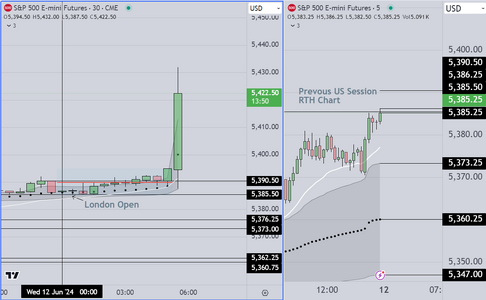
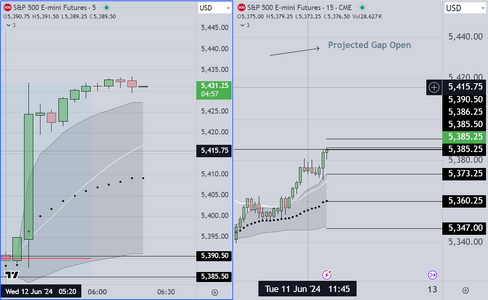
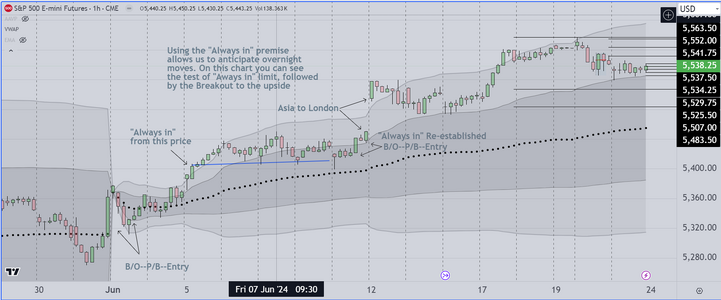
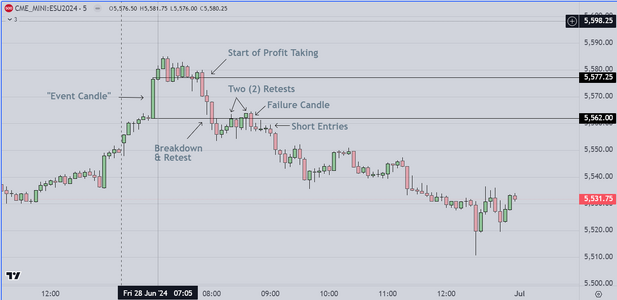
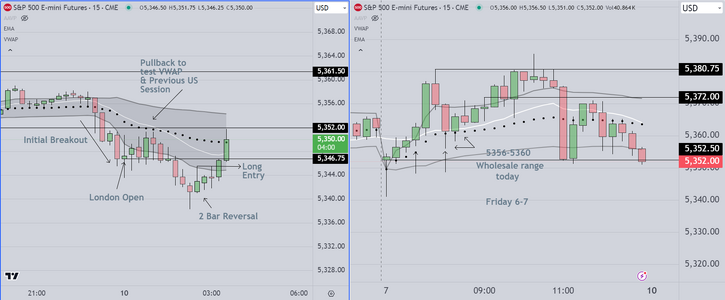
The attached chart shows price action as London Opens. We have been trading this open
because often it is the only trend we will see until the FOMC events conclude
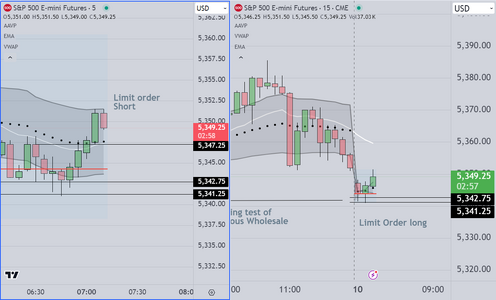
We have amended the chart a couple of times, to show the initial breakout to the downside
followed by a two bar reversal back to the upside. Notice that the upside bars are "strong"
meaning that they are relatively wide range, closing near the extreme.
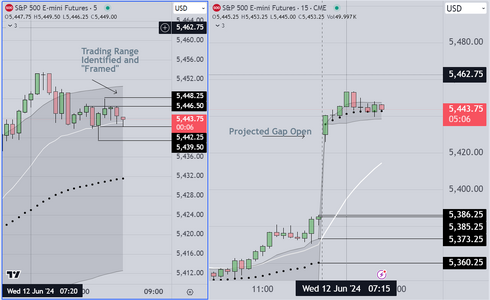
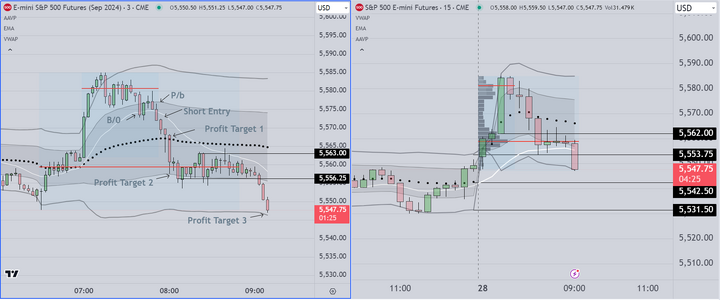
SETUPS

Breakout

The initial break to the down side follows our protocol and that is a) breakout, followed by
retest of a "Key" reference such as the VWAP or (in this instance) the previous US open
Short entry is made when the test fails, and price resumes its break to the downside.
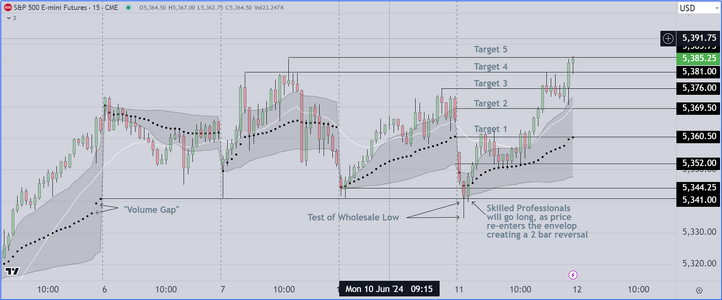
2 Bar Reversal

After a reversal occurs, we mark the top or bottom of the 2nd bar as the point of
entry in the opposite direction. Odds of this trade being successful are increased
because of the context, so we took both entries, however it is considered good
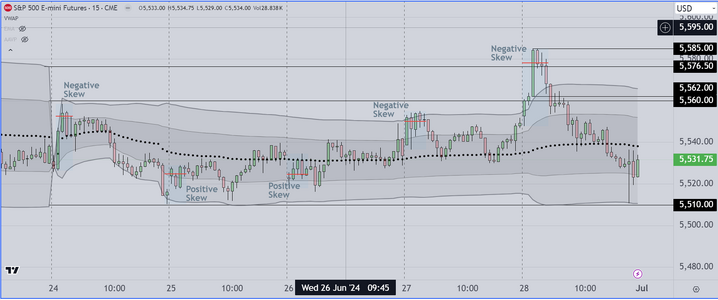
practice to include "skew" as confirmation. Because the skew is a dynamic process
it is difficult to display properly in this context (not enough room on the chart to
display and include text explanation)
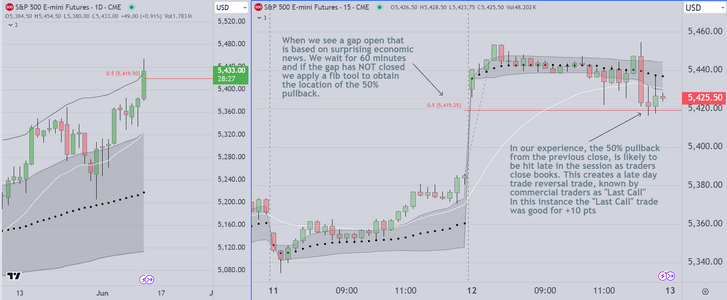
Final Comment

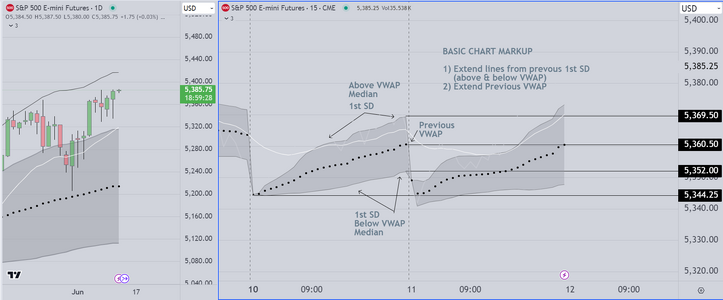
Notice if you will, that the breakout trade requires that price break either above
or below the darkened area that we call the VWAP envelope. That is after all, why
it is called a breakout. In contrast, the odds of success for a 2 bar reversal are greatly
increased if you pull the trigger as price enters INTO the darkened area, and your
initial profit target is at the VWAP line. This is understood by traders who have a
basic understanding of statistics.


Good Luck
 

Attachments

  • London Open FOMC Week.PNG
    London Open FOMC Week.PNG
    140.9 KB · Views: 40
Last edited:
Here is an example of a limit order long, taken
when the market tested previous Wholesale
low, and in the process created a double bottom
Its a small scalp. Basically just closing the overnight
gap
 

Attachments

  • Limit Order Scalp Exmple.PNG
    Limit Order Scalp Exmple.PNG
    117.2 KB · Views: 15
Last edited:
And this is a limit order short at the top of the
VWAP envelop

I explained how this works in the previous post
It is very difficult for me to post and trade this way
so I will concentrate on what I am doing and stop
(posting) at this point
 

Attachments

  • Liimit Order Short Example.PNG
    Liimit Order Short Example.PNG
    104.1 KB · Views: 16
While we monitor price action from London Open to start of US session

On the left, we show the Daily chart, and you may notice that at the top
you see a horizontal red line. The relationship between that line and the
VWAP (dots), displays what skilled traders call a "negative skew", which
means that the statistical preference is to the downside. In addition
the Daily candles display several types of price action setups. We won't
be going into that in this post, however they also suggest a directional
bias to the downside.

On the right side, we show 15 min candles. This is a Globex (ETH chart
This chart starts at 1500 hours local time (Asia session) and runs into
the London Session (Midnight Local time) and from there to the start
of the US session. As you may notice, after the start of London Session
price does move down, which confirms what the data suggests. Very
easy trades to take for disciplined professionals.
 

Attachments

  • Overnight Chart Example.PNG
    Overnight Chart Example.PNG
    143.1 KB · Views: 15
We removed the candles from the chart we attach below, so that
we can show the basic chart markup rules that we follow

As seen below, we extend horizontal lines from the 1st standard deviation bands
above & below the Black Dotted Line (VWAP) AND from the VWAP itself. This
creates an "envelope" that professionals use as the basis for profitable trading.

The way it works is relatively simple.

1) Professionals know that this framework can be used to VISUALIZE whether price
is trending or creating a trading range. How? well if price closes above or below
the 1st standard deviation, it is likely that price action is now considered to be
trending, and will remain in a trend AS LONG AS price closes above or below the
1st standard deviation band (above or below the dark area inside those bands).
2) If price moves stays inside the darkened area (within the 1st SD on either side
of the VWAP) is means that we are in a trading range. When that happens, skilled
traders mark the high and low closes and they trade using limit orders, entering
at one extreme, exiting at the VWAP (black dotted line) or at the opposite SD
(this is called "scalping")


The second chart shows the same chart, but with candles added AND we add
horizontal lines to show the high & low CLOSES for the previous session as well
as the session high and low. institutional and commercial traders rely on the
high & low closes in order to make decisions, because these closes are the basis
for trend reversals, and often occur at prices that represent wholesale or retail
highs and lows.

These might be the two most important charts that we post in this thread
 

Attachments

  • Basic Chart Markup.PNG
    Basic Chart Markup.PNG
    145.3 KB · Views: 11
  • Basic Chart Markup with Candles.PNG
    Basic Chart Markup with Candles.PNG
    162.5 KB · Views: 11
Last edited:
This is our last chart for today

We show the method that skilled traders use to Identify and mark
profit targets AHEAD OF THE OPEN

We make the assumption that price will likely test one way (to the
Wholesale low at the bottom of the chart), then reverse, trapping
traders on the wrong side, as the institutions move price higher

This is a well known strategy and recognizing it early is one of the
ways that I make a consistent living

Final Note

People who look at the chart may ask themselves, "if the targets are
determined ahead of the open, how often do they get hit"?. The answer is
that it depends on the context. If we are in a trading range, it is not unusual
for all the targets to be hit. The reason this happens is that institutions and
funds HAVE TO move price a certain distance, in order to make enough profit
to overcome downside risk. If you simply go back in time and look at previous
months, you can see that this happens quite often. As mentioned, this is how
I (and many other professionals) make a living.

My next posts will be to setup two (2) live trading sessions so that
interested persons can see how it is done in real time.
 

Attachments

  • Profit Target Markup.PNG
    Profit Target Markup.PNG
    148.3 KB · Views: 9
Last edited:
This is one of our pre-open charts

During the overnight market (Asia to London, and London to US)
we evaluate price action in the context of pending economic reports

1) In about an hour's time, we will see US "Core CPI" post
2) Later in the day (at about 2pm EST) FOMC Statement will be released
(institutions expect that interest rates will stay unchanged)
3) 30 minutes later the FOMC press conference will occur

During our classes, we show students previous patterns of price
action prior to and after these reports. This allows the trader to
make fully informed decisions and to react to changes calmly
and intelligently.
 

Attachments

  • Pre-Open Analysis 6-12-2024.PNG
    Pre-Open Analysis 6-12-2024.PNG
    164.3 KB · Views: 8
and here is the S&P 500 Futures response to the Core CPI release

As you review the previous chart, notice that the skew was "up" early
and price action indicated that institutions expected a positive report
nevertheless, surprises do occur, and so we trade the price action
prior to the report and after, but do not try to anticipate and position
AT the release. From this point forward, Best Practice is to trade the skew
and price action setups framed by the VWAP envelop.

Good luck Everyone
 

Attachments

  • Market Response to Core CPI.PNG
    Market Response to Core CPI.PNG
    96.8 KB · Views: 9
And this final chart today shows the projected gap up
start to today's S&P 500 Futures Market. We expect
the market to retrace down into the VWAP envelop
for a short trade as participants take profit on the
reaction to the economic report (CPI)
 

Attachments

  • Gap up after CPI.PNG
    Gap up after CPI.PNG
    100.5 KB · Views: 11
As often happens when we have a surprise OR a trading range
we have time on our hands

This is a chart example, showing how we frame trading ranges
by extending lines from each successive closing high & low
Traders with the appropriate skills, would be entering at retests
of each extreme using limit orders

Obviously, today's gap up open did not fill and so far it has been
a "gap and run". We took a couple of early losses and have just
gone back into the green. As with any surprise day, it is a matter
of identifying quickly when you are wrong, then making the necessary
adjustments.
 

Attachments

  • Trading Range Framing Example.PNG
    Trading Range Framing Example.PNG
    112 KB · Views: 11
This was a nice end to the day

The attached chart shows a setup known by
professionals as "Last Call"

Simply put, if a gap open occurs as a result of
surprising economic news, and does not close within
the first hour, we apply a Fib tool, to locate the 50%
retracement level. It is assumed that at the end of session
price may hit this level, triggering a final trade as professionals
close their books. Today that trade was good for +10
 

Attachments

  • Last Call Example.PNG
    Last Call Example.PNG
    176.3 KB · Views: 8
We expect some "persistence" with regard to yesterday's breakout. Today we have two economic reports
as follows

1) Initial jobless claims 8:30am EST
2) PPI 8:30am EST

As regards price action, we expect early trading range, followed by a possible breakout to the downside
prior to resumption of prior trend. Amateurs and retail traders should trade small and scalp (3 points max)
while professionals will probably monitor and when the see an opportunity, will scale in as they trade around
longer time frame ("always in") positions. This suggests that the longer time frame trend is still in place.

For traders who have been struggling, we suggest standing aside and waiting for a breakout from the
VWAP envelope (if they are using it) The basic protocol is to wait for a breakout, entering on the first
pullback in the direction of the primary trend.
 

Attachments

  • Day After FOMC.PNG
    Day After FOMC.PNG
    124 KB · Views: 7
and this follow up chart as the economic reports (Jobless and PPI)
are released

As can be seen, the upside target was hit

This was relatively easy to trade, since you can see
the prices where commercial traders were positioning
themselves (look for the prominent tails on multiple
candles)

We updated the chart, noticing that one of the overhead price
targets was missing. The basic premise is unchanged
 

Attachments

  • Followup Econ Report.PNG
    Followup Econ Report.PNG
    131 KB · Views: 10
Last edited:
Here is the weekly review that we will develop during this weekend's class

The patterns that we make visually apparent on the attached chart, are NOT unusual.

We outline the (institutional) behaviors, and the reasoning and try to use proven models
(wholesale-retail cycles) to make sense of what seems (to the uneducated) to be random
casino like behavior. When you look closer, and with benefit of the right tools, it all starts
to make sense

Good luck in the coming week
 

Attachments

  • Weekly Review of Price Action.PNG
    Weekly Review of Price Action.PNG
    114.3 KB · Views: 15
We will post this chart of the longer time frame action
showing how professionals use "Always in". As the phrase
suggests, once the market is deemed to be "Always in" then
both institutions and commercials look to stay long (or short
as the case may be) until the end of the time period (weeks to
months at a time).

All of this is contingent on the market's response to subsequent
tests of a range of prices.

Our current class is full so no more posts until space becomes
available

Good luck Everyone
 

Attachments

  • Longer Time Frame Always In.PNG
    Longer Time Frame Always In.PNG
    166.8 KB · Views: 15
My class ended today. The clients were fund traders
recently hired and hoping to pick up some new ideas.
Smart people and motivated to learn.

Everyone had a background in basic maths and so we
were able to short cut the explanations and get right to
the heart of the matter (how to use a statistical method
to frame price action)

Today was an event day, and this group already knows the
basic protocol (how to trade a wide range "event candle")
For those of you who are not familiar with this process, we
observe the "event candle (5 min time frame) and we mark
the O/H/L using horizontal lines. Then we wait for the inevitable
profit taking process to occur. There are several ways to enter
(in this case short entries) and for skilled persons this is an easy
and profitable day.

We have also marked the standard "reversal" entry based on
the statistical skew. Again this was an easy day, as the short
entry was easy to identify. All you had to do was get on board
and hold to the obvious profit targets.

Final note, most commercial participants trade multiples of ten
(10) contracts minimum and so we identify multiple profit targets
 

Attachments

  • Event Trading Example.PNG
    Event Trading Example.PNG
    156.5 KB · Views: 8
Some have suggested that the framing tools make it difficult
to see the price action

The attached (clean) chart shows the conceptual process for trading an
"Event Candle". This is well known to professionals and is relatively
easy to execute (if one has the confidence and discipline to do so).

Traders should note the following

1) Once price falls below the "event candle", traders will wait for
at least one (1) and hopefully two (2) attempts to reverse back
into the "event candle" space.

2) When the 2nd attempt fails, that candle is called the "give up".
Professionals see this and know that this is the time to get short

3) The general rule of thumb is hold as long as possible (preferably
to the end of session).
 

Attachments

  • Event Trading Example 2.PNG
    Event Trading Example 2.PNG
    65.3 KB · Views: 7
Last edited:
And this last example shows the Weekly VWAP
Some traders prefer this version, because it frames
the price action over a longer period, providing
critical context. I prefer it myself because it allows
me to anticipate what we call "range expansion".
In practical terms, this means that as the session
progresses I can see if the range is "correct". If
for example the range is small, then I can anticipate
that it will expand as the day wears on, allowing me
to hold winners longer.

Traders should also notice that we have marked
the "Statistical Skew" for each day of the week
"Negative Skew" suggests price will move lower
"Positive Skew" suggests price will move higher
This dynamic indicator changes orientation as
each candle unfolds. We show traders how to
select the initial anchor and termination points
and how to re-position it as the session unfolds.
 

Attachments

  • Weekly VWAP Example.PNG
    Weekly VWAP Example.PNG
    131 KB · Views: 10
Good Morning Everyone

Attached is an example of my pre-open chart Markup

What you see is my Primary Display, with Daily chart on the left
and 15 min candles (previous session RTH) on the right

The important data points are as follows

1) The statistical skew is neutral, indicating a symmetrical market where the odds
of a move up or down are about equal. This is typical of a market waiting for economic
news which in this case is about Fed Policy

2) We mark the overhead and sub Price targets based on the VWAP spread, which is
how the institutions view the market. On the left side, the daily chart shows the important
targets above and below. On the right side we show the targets for the next session

Framing

We frame the market based on the response we see in real time, to high impact news events
Basically we extend horizontal lines from the time period when the news is released
and then we wait for price action to tell us whether to orient to the long or short side
This framing technique never fails, so the REAL test is whether the trader can execute
and manage the trade properly once the result is clear.

Good luck everyone
 

Attachments

  • Pre-Open Prep Chart Markup Example.PNG
    Pre-Open Prep Chart Markup Example.PNG
    146.5 KB · Views: 5
Here we are 5 min from the open and I am posting my Secondary Screen
showing the status of the market after the 1st release of high impact news

We will watch and wait for price action to indicate which way the market will
move today..
 

Attachments

  • Pre-Open Economic Report Example.PNG
    Pre-Open Economic Report Example.PNG
    117.9 KB · Views: 7
Top