Beyond Price Action

steven46

Junior member
Messages
36
Likes
6
I have already posted some ideas, meant to assist struggling traders

One of those concepts is called the "Run-Up" or "Run-Up Trade" An associate of mine
also calls this "Stealing the Trade"

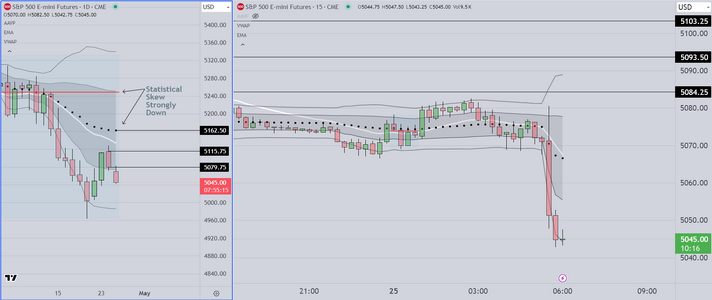
Basically, institutions and funds take advantage of a usually quiet overnight market
to move price in advance (news organizations often use the language "in the run-up to")
a specific high impact economic report. As I have mentioned in the thread "Long Road to
Success", this allows them to accumulate inventory, wait for the open of the RTH session
then sell the marked up inventory, thus realizing significant profit, with very little risk.

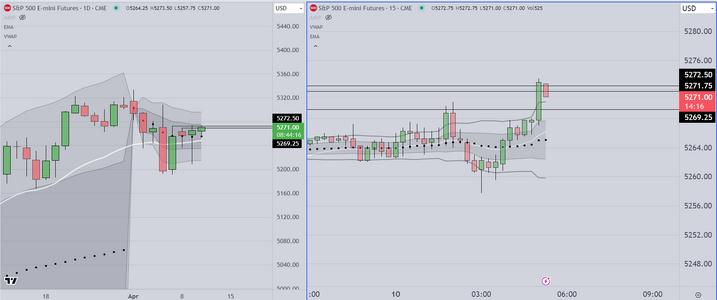
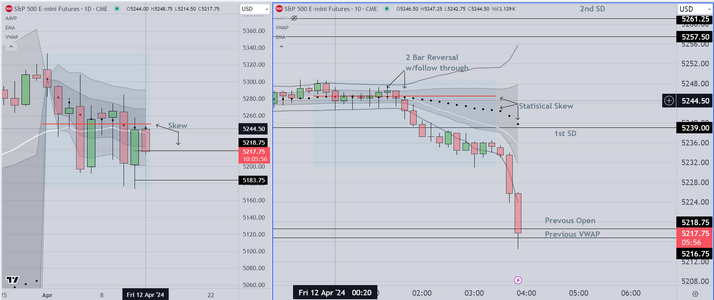
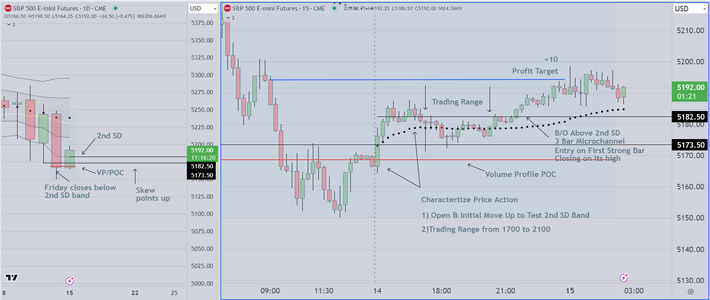
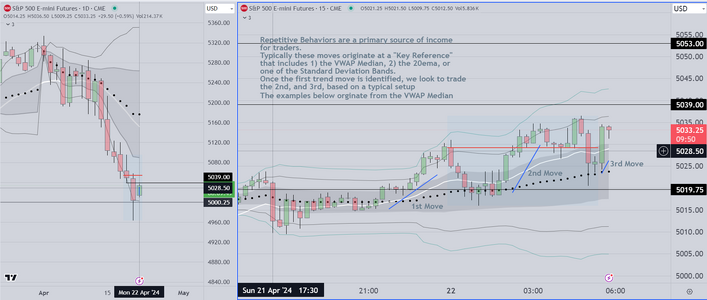
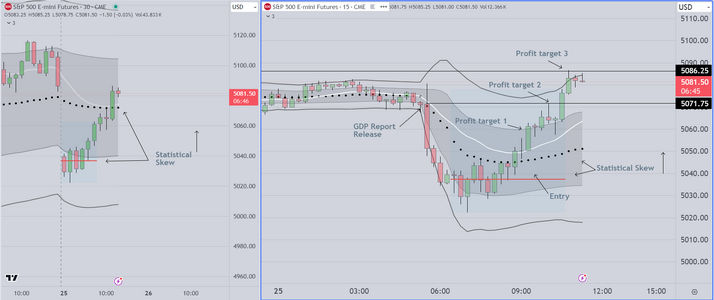
I have many examples (I use them for training purposes) and what you can see in the
current example is the "measured move" up just prior to the release of economic news
today.

I will post a few more charts and miscellaneous examples, and then I intend to continue
on with my own blog of the same name ("Beyond Price Action").

Wish you all the best of luck
 

Attachments

  • Stealing the Trade Example 2.PNG
    Stealing the Trade Example 2.PNG
    108 KB · Views: 49
and here is the follow up to my previous post. As seen in the chart, the news came out
and the result was a spike down. As you can see, they sold it down, making a nice
profit, with essentially zero risk. This happens quite often. Although I rely on my own
research, there seems to be some academic literature regarding trading in the overnight
markets if anyone is interested. This has become an increasingly important profit center
for my own program
 

Attachments

  • Stealing the Trade Followup2.PNG
    Stealing the Trade Followup2.PNG
    119.7 KB · Views: 22
Today was an excellent example (for folks struggling to find an edge) of a "trading range" day

This type of price action is characterized by candles that overlap, and often have prominent tails
I anticipate this type of behavior as a result of the FOMC minutes although it can happen
"in the runup" to a number of high impact economic reports. I learned how to handle trading
range behavior from an old friend at Bear Stearns. He was kind enough to show me how to frame
the the price action (marking the highest and lowest closes) , how to use limit orders at the extremes
to enter trades and when to get out (at the VWAP median. I remain grateful to him for his help
That kind gentleman passed away recently and that is (in part) why I am posting this information
now.
 

Attachments

  • Trading Range Framng Example1.PNG
    Trading Range Framng Example1.PNG
    140.3 KB · Views: 20
Hello

Here is another example of the process I use to trade the London Market (here on the West Coast
USA, it is an "overnight" trade that can last quite a long time)

My process starts with evaluation of the Daily Chart, which (for now) suggests that we are in a trading range
I also look at the forthcoming economic reports, to anticipate which way institutions might lean
Finally I know from experience that there are specific time periods, where I might expect automated
trading to predominate, moving the markets toward a specific goal (in this case, it looks as though
the preliminary goal is profit taking (risk reduction by taking partial profits). Once this is accomplished
the larger institutions often "rinse & repeat" during the next US session, buying at the low of that session
and marking that inventory "up" into the close. This cyclic behavior is easy to spot and once you see it
it is possible to "go with" and thus profit

The setup is a simple breakout, based on a "2 bar reversal with follow through" The framing mechanism
I use is the VWAP with 1st & 2nd Standard Deviation Bands. Once price closes (strongly) outside the 1st
SD, we assume that trending behavior has begun and it makes sense to hold (and add to ) a position.

At the US open, we then take profit, along with the rest of the institutions, waiting to see how they will
proceed.

Best of Luck Everyone.
 

Attachments

  • London Market 2 bar reversal example 2.PNG
    London Market 2 bar reversal example 2.PNG
    127.7 KB · Views: 15
While posting the previous, a significant move down occurred and my risk management rules
require that I take profit now, rather than wait. So I am flat. There are real issues as regards
Sleep management too, and I have learned not to trade while sleep deprived. Time to get
some sleep.
 

Attachments

  • London Followup 4-12-2024.PNG
    London Followup 4-12-2024.PNG
    144.8 KB · Views: 20
Anticipating that an overnight move is possible I stayed up to monitor price action starting with
the Asia open at 1500 hours (West Coast USA). I have simplified the chart as much as possible

The basic chart shows price framed using a Weekly VWAP with 1st & 2nd VWAP Bands
the position of the VWAP (black dots) relative to VP point of control shows the statistical
skew (which points up).

Once price breaks above the 2nd SD ( on a 3 bar microchannel ), entry is possible on a
strong bar, closing on its high. My review of odds suggests about 68-70% chance of
success. In this instance it worked out and the setup resulted in a 10pt profit.
Stop Loss placement dependent on the operator.

If there is interest we can talk about how one might "anticipate" the overnight move
using the left side of the chart and development of VP vs VWAP "Statistical Skew"
 

Attachments

  • Overnight Breakout Example.PNG
    Overnight Breakout Example.PNG
    120.6 KB · Views: 19
This outline is a summary of the basic Pre-Market Preparation that I use

1) On a chart with daily candles, identify the price action (trend or trading range)
2) Using charts w/15 min candles, Identify "Tests" of important prices (5000 in the Emini for example)
3) Switch to 5 min candles and review price action on a session by session basis, start with previous Monday RTH
Go back to review the ETH session's behavior
4) Evaluate Volatility, make note of the average range (Monday through Friday)
5) Gap Analysis. Start with the daily chart. Identify gaps (expecting them to close eventually)
6) Statistical Skew. This is the difference between the VWAP and the Volume Profile POC and can be
determined from the previous session and can be used to decide whether to trade from the long
or short side

Objectives

1) Accurate Scenario Creation. After a period of consistent preparation. what you will find is that
you can start to predict with good accuracy, what will happen (generally) from session to session.

2) Based on consistent review of session charts (Monday through Friday RTH) an observant trader
can start to see behavior patterns as follows.
a) Day type....within the first three to four candles, a skilled observer can tell if the market is
likely to trend or exhibit trading range behavior
b) Skilled traders factor in the release of high impact economic reports. Based on this knowledge
you can see (well in advance) when markets will "stall" and when the markets will trend overnight
as institutions "steal the trade" prior the release (see my previous posts on this subject).

Note

Much of he benefit of this practice, has to do with discipline and building upon previous session analysis
The basic analysis (daily chart price action) can be done in about 15 minutes. Analysis of Monday through
Friday session price action takes about an hour, and more detailed analysis of volatility, gaps, tests and
scanning for repetitive behavior can take about 30 minutes. I complete much of this work on a Saturday
and Sunday. For traders who don't think it is necessary, I use the analogy of pro sports. We know that
professional athletes begin with superior natural talent. What is less well known is how much additional
work they put in, studying game films and practicing.

In my blog, I go into detail, developing each part of the process so that folks can either use it as I do,
or adapt parts of it to suit their needs.

In the post below this one, I attach a chart to show context. The chart has two (2) parts, on the left, a small "daily" chart
and on the right, two (2) intraday sessions. This way of "framing" the developing market works
to show (quickly) whether the new session is likely to trend or move sideways into a trading range.
One can also see how price tests the VWAP (dark black dots) and the standard deviation bands on
both sides
 
Last edited:
Refer to previous post last paragraph, for explanation
 

Attachments

  • New Chart Example 1.PNG
    New Chart Example 1.PNG
    126.4 KB · Views: 18
This will be my last post for a while.

The chart example shows the use of a tool that I created to further frame (to go
"beyond price action"). I call it "volume gap" and depending on the skill of the
operator, it can confirm either continuation (as in the attached chart example),
reversal, or sideways (trading range) behavior. When used in conjunction with preparatory
evaluation, these tools allow me to anticipate a positive expectancy that ranges
from 76-81% over a sample size of about 2,800 trades. I have not tested over a
larger time frame, and therefore cannot make claims with regard to down or sideways
markets.
 

Attachments

  • Volume Gap Example.PNG
    Volume Gap Example.PNG
    124.7 KB · Views: 18
Before the open of the US Market (Emini) we have time to post a comment regarding
the way we identify trade opportunities based on "Repetitive Behaviors". The text
in the chart explains that we look to identify specific behaviors that originate at
"Key References". Aggressive traders can trade the first move, however we like to
watch first and trade the 2nd and 3ed moves.
 

Attachments

  • Identifying Repetitive Behaviors 1.PNG
    Identifying Repetitive Behaviors 1.PNG
    175.4 KB · Views: 10
Referring to the previous post, here at the open, we see "repetitive behaviors",
two (2) trend moves, and we see that these moves originate at tests of the
20 ema
 

Attachments

  • Repetitive Behavior Example 2.PNG
    Repetitive Behavior Example 2.PNG
    146.5 KB · Views: 14
The process of identifying "repetitive behavior" seems to work consistently well in the current environment
This is because the folks who code the automated systems for large institutions, possess a background in
statistics & probabilities, which they rely on to generate about 70% or volume in the most liquid markets worldwide.

This fulfills my obligation to "pay it forward" to an old friend who worked for a now extinct American firm
as a trader. The basics are as follows

1) A candlestick chart displaying VWAP (on several time frames) with 1st, 2nd and 3rd standard deviation bands
extending on either side of the median.
2) Just the POC from a Volume Profile display (nothing else).
3) A 20 period EMA

Recently there have been quite a few views of the data, but no questions, therefore I will withdraw and leave
the rest to random chance.


Good luck
 

Attachments

  • Repetitive Behavior ETH Example.PNG
    Repetitive Behavior ETH Example.PNG
    141.6 KB · Views: 14
interesting thoughts! Your trending moves look like waves!
The process of identifying "repetitive behavior" seems to work consistently well in the current environment
This is because the folks who code the automated systems for large institutions, possess a background in
statistics & probabilities, which they rely on to generate about 70% or volume in the most liquid markets worldwide.

This fulfills my obligation to "pay it forward" to an old friend who worked for a now extinct American firm
as a trader. The basics are as follows

1) A candlestick chart displaying VWAP (on several time frames) with 1st, 2nd and 3rd standard deviation bands
extending on either side of the median.
2) Just the POC from a Volume Profile display (nothing else).
3) A 20 period EMA

Recently there have been quite a few views of the data, but no questions, therefore I will withdraw and leave
the rest to random chance.


Good luck
interesting thoughts! Your trending moves look like waves!
 
Hello Hellena

Thanks for your comment. Yes there are similarities between my method and Elliot Wave

Here in California, I am waiting for an economic report (GDP) to be released
While waiting I want to post a chart, showing additional (repetitive) tradable moves
that seem to occur in groups of three. The attached chart shows both trend and countertrend
trade setups

My charts offer traders several ways to frame price action. Based on analysis of previous
week's charts, I look for price to test one of several "key references" that include

1) VWAP median
2) Standard Deviation Bands
3) 20 Period EMA
4) Previous Session's Open, High & Close

My process begins anytime I see either a test of, or a breakout above or below a Key Reference
After that happens, I use a binary decision process to guide me and to take emotion out of the
equation

Good luck today
 

Attachments

  • Trend & Countertrend Examples.PNG
    Trend & Countertrend Examples.PNG
    123.5 KB · Views: 7
Last edited:
This followup chart shows the price action after release of GDP

Observant readers will review the previous chart and on the right side
that chart shows the higher time frame statistical skew pointing down

This is not unusual. The statistical skew allows the skilled operator to
know well in advance whether the big institutions believe that the
report is going to be positive or negative. There could be (and sometimes
are) surprises, however in our experience, this process suggests that
"someone" knew (or thought they knew) what the result would be.
 

Attachments

  • Followup Econ Report.PNG
    Followup Econ Report.PNG
    116.4 KB · Views: 9
Some comments regarding trading around "high Impact" Economic Reports.

First, let me say that trading the actual release is left to the HFT (high frequency) firms. They have the
technology and expertise to execute "at the release", using limit orders primarily. We won't be going into that
process

As regards trading "the session". We look to our basic tools (VWAP and Statistical Skew) to provide opportunities
AFTER the release. We monitor the release and based on our experience, we look to trade "with" the skew. Why?
Because the skew reflects the collective opinion of the top tier firms, and we know that they are willing to assume
risk and to commit money, especially if they believe that they know what the response will be once the report is
released. One might ask the obvious question, if the report was negative, why would the market test down during
the ETH session, only to reverse during the RTH session? In our experience, there are two (2) objectives, the first is
to "trap traders out" so that they have to chase. This (traders chasing the market) is what propels the market as it
breaks to the upside. The second is to cause bears, to feel as though they may want to buy back their shorts
(it is called a "pain trade"), and what we are seeing today is (in part) weak bears buying back their shorts.
 

Attachments

  • Trading GDP Report.PNG
    Trading GDP Report.PNG
    132.3 KB · Views: 11
Last edited:
The Role of Volatility

LEFT SIDE CHART

The attached chart is composed of two (2) sections. On the left, the chart shows 30 minute candles and is "framed" by
a Weekly VWAP. As always, we use the skew (difference between VWAP and Volume Profile POC) to identify the high percentage entries
Also as you review that chart, notice that we used a Fib tool to show the 50% Pullback area, which is one way of determining
possible support (or trade entry). As we approach each session's open, we start our evaluation using this chart.

RIGHT SIDE CHART

On the right we show our primary chart (15 minute candles) using ETH data. Using these two (2) charts, we can see
that prior to the open, buyers come in to create support at that (red) line. Also we can see that the same statistical
skew we saw on the left, is also apparent on the right side, confirming that the odds favor a long entry.

PRE-MARKET PREPARATION

Finally, based on analysis (of the previous week's price action), we KNOW that for this market (S&P500 Futures) volatility
is highest during first hour. Therefore, holding a long entry during the first hour provides the best chance of obtaining
a "swing" profit of seven (7) to perhaps ten (10) points. In this instance, a long entry resulted in a ten (10) point profit.
 

Attachments

  • Higher Time Frame Key Reference.PNG
    Higher Time Frame Key Reference.PNG
    127.2 KB · Views: 10
Hi Steven,
I'm struggling to get my head around what you refer to as 'statistical skew' which, if I've understood you correctly, is based on the relationship between the Volume Profile 'Point of Control' (PoC) and VWAP.

In the chart below, I've attempted to duplicate your 30 minute chart, showing the PoC in red and anchored VWAP, starting at last Monday's open, with the median line in blue and showing the 1st and 2nd standard deviations. Using my chart, can you explain how these two indicators show statistical skew, please?
Tim.

steven46.png
 
Hello

One of the problems that traders often encounter is lack of math background.
I suggest that aspiring traders take basic (first year) Statistics & Probabilities
otherwise they end up going in circles (for example). Here in the US, first year
Stats consists of about 20 weeks for the first part (100 level) and the same for
level 200

VWAP has to be started at the beginning of the current session.
Alternatively you can use the previous session as a starting point. In contrast
you can start the volume profile (POC) wherever you wish. One thing that has
to be pointed out is that you have to wait for a period of time, for the VWAP
POC combination to collect a stabile sample size. For my system, I like to wait
at least 15 minutes. (basic stats)

Using your chart, if the red line at the bottom is POC and the blue line is the
VWAP, refer to the paragraph below

If the POC is above the VWAP the skew is down, conversely if the
POC is below the VWAP the skew is up. If the VWAP is at or near the POC
then you have a symmetrical distribution and there is no skew. Finally, and
this should be self evident, price (the distribution of prices during a session)
is dynamic so the position of the POC will change relative to the VWAP as more
data is accumulated during the session.

Honestly there is a lot more to this than I can cover in one post. Again I suggest
the best place to start is with first year statistics. If time permits I will post some of
the basic math
 
Last edited:
. . . Again I suggest
the best place to start is with first year statistics. If time permits I will post some of the basic math
Hi Steven,
Thanks for the reply.

I don't doubt that having a sound understanding of statistics is likely to be helpful to all traders. That said, I presume you don't expect beginners or experienced traders alike to take a minimum of one - and preferably two - 20 week classes in statistics simply in order to be able to understand your methodology? ;)

Re, VWAP - I plotted it at the start of last Mondays session to cover the entire week - as you specifically refer to weekly VWAP in your previous post. So, you're now recommending a daily VWAP plotted at the start of each session - is this correct?

You write: "If the POC is above the VWAP the skew is down, conversely if the POC is below the VWAP the skew is up." That's clear enough, but you don't mention where price is in relation to the two indicators. Is it relevant - does it matter?
Tim.
 
Top