OilTrading.blog
Junior member
- Messages
- 12
- Likes
- 1
I have witness some interesting price action this week. In this article I want to speak about some particular set-ups that prove to be very reliable and profitable indicators: when the price action is diverging from the newly published data.
(Original Article here)
I have two recent examples in mind:
(1) Market rising despite bad news.
Context:
We were in a downtrend between Monday 06.02 and Wednesday 08.02. After reaching the top of the range the previous week the prices were heading lower.
The API report went out on Tuesday night and there was a gap lower to $54.60 (Brent).
Next day (08.02): EIA report which confirms the huge build-up in inventories.
The U.S. Energy Information Administration on Wednesday reported a fifth straight weekly increase in crude-oil supplies that was much more than the market expected. Inventories climbed by 13.8 million barrels in domestic crude-oil supplies for the week ended Feb. 3. The American Petroleum Institute late Tuesday reported 14.2 million-barrel jump, according to sources, while analysts polled by S&P Global Platts forecast a climb of 2.5 million barrels.
Yet this happened:

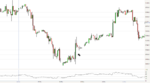
Hourly Brent Chart ($)
Despite this news the market had a big leg up (black arrow). And then went higher and higher for the rest of the week.
When he market is rising despite bad news, go long.
I can’t explain the underlying forces that drove the market higher, but I think the whole point is to understand the “mood” of the market. If you see prices going higher on bad news, you can be sure there are huge buying pressure and you can ride the tide without too much concerns.
(2) Market dropping despite good news
Yesterday, Monday 13.02.2017 we could witness quite the same phenomenon.
OPEC published a pretty bullish report (better demand data for 2016, better demand expectations for 2017, reaffirming that the market will be balanced in 2017..) . Yet, after an initial leg up the market went down (black arrow is the time the OPEC’s report was released).

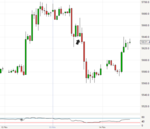
Hourly Brent Chart ($)
The following move was less exaggerated that for the previous example but we saw a pretty significant drop nonetheless.
When the market is dropping despite good news, go short.
Conclusion
I think those two example show the importance of not relying only on the hard data. The oil market is way more complicated. Sometimes the price action seems to be very very irrational but who cares? We just need to understand who has the upper hand – the bulls or the bears – and go with them.
Trading rules:
When he market is rising despite bad news, go long.
When the market is dropping despite good news, go short.
(Original Article here)
I have two recent examples in mind:
(1) Market rising despite bad news.
Context:
We were in a downtrend between Monday 06.02 and Wednesday 08.02. After reaching the top of the range the previous week the prices were heading lower.
The API report went out on Tuesday night and there was a gap lower to $54.60 (Brent).
Next day (08.02): EIA report which confirms the huge build-up in inventories.
The U.S. Energy Information Administration on Wednesday reported a fifth straight weekly increase in crude-oil supplies that was much more than the market expected. Inventories climbed by 13.8 million barrels in domestic crude-oil supplies for the week ended Feb. 3. The American Petroleum Institute late Tuesday reported 14.2 million-barrel jump, according to sources, while analysts polled by S&P Global Platts forecast a climb of 2.5 million barrels.
Yet this happened:
Hourly Brent Chart ($)
Despite this news the market had a big leg up (black arrow). And then went higher and higher for the rest of the week.
When he market is rising despite bad news, go long.
I can’t explain the underlying forces that drove the market higher, but I think the whole point is to understand the “mood” of the market. If you see prices going higher on bad news, you can be sure there are huge buying pressure and you can ride the tide without too much concerns.
(2) Market dropping despite good news
Yesterday, Monday 13.02.2017 we could witness quite the same phenomenon.
OPEC published a pretty bullish report (better demand data for 2016, better demand expectations for 2017, reaffirming that the market will be balanced in 2017..) . Yet, after an initial leg up the market went down (black arrow is the time the OPEC’s report was released).
Hourly Brent Chart ($)
The following move was less exaggerated that for the previous example but we saw a pretty significant drop nonetheless.
When the market is dropping despite good news, go short.
Conclusion
I think those two example show the importance of not relying only on the hard data. The oil market is way more complicated. Sometimes the price action seems to be very very irrational but who cares? We just need to understand who has the upper hand – the bulls or the bears – and go with them.
Trading rules:
When he market is rising despite bad news, go long.
When the market is dropping despite good news, go short.