😆 yes, but you were able to demonstrate the disaster risk he was running. Can you with this? I'd be pleased to hear it if you can because I can't.
OK - your assertation is this.
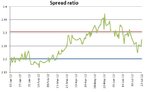
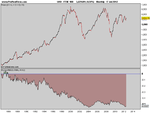
DOW & FTSE are correlated. This correlation will remain in all circumstances. Despite the two instruments being in different currencies, there is no risk of the correlation breaking down for long enough for my account to suffer a major loss or margin call.
The similarity between your strategy, Howards strategy and Spanish89 strategy is that they all promise security and absolve you from thinking out any particular trade.
You are absolved from all stress or worry about your trades. You are making money stress free. But is that because you have no risk of ruin or because you don't understand the risk of ruin?
Now - I am not saying the DOW & FTSE are not part of institutional stat arb trades. In fact, such things more than likely exist (hence the correlation) but there is almost certainly a forex component of the arb trade.
As I mentioned above, stat arbs are not 'always on'. In the case of stocks, it's often stock vs stock, stock vs industy, stock vs sector etc. In these cases, there is always risk of the correlation breaking down because of 'black swan' events - such as analyst upgrade/downgrades, buyouts or CEOs fingers in pies. These are unknown risks. Known risks are planned events such as earnings announcements and con calls.
In your strategy there is no mitigation for unknown risks and you haven't really looked very hard into known risks.
Now - you have 'challenged me' to don't demonstrate the risk, based on your prior replies, you will say "the pairs mitigate the risk". Thus, you will continue to be absolved of further research because I have not proved beyond doubt that this is unsafe.