Back test results - 2 simple price patterns

Johnnyalpha8

Junior member
Messages
26
Likes
0
I've just back tested a couple of simple patterns '3 falling peaks' and '3 rising valleys'. The names are kind of self explanatory. Thomas Bulkowski tested them on 500 stocks, each over a period of 5 years, and found them both to be profitable. Here are the results of my back-test of these pattern with futures:

Market: E-Mini S&P 500
----------------------
Set up: Short on b/o of 2nd new low in trend on Thursdays and Fridays, 1st/3rd week of month.
Long on b/o of 2nd new high in trend, if it has a tail on Thursdays in 1st/2nd/3rd week of month.
Longs require a rising 600sma (current close must be higher than close last week this time (approximately)).
Shorts require a falling 600sma (current close must be lower than close last week this time (approximately)).
Profit: Exit on first open that has a profit of greater than one point.
Stop Loss: At most recent Active Low/Most recent Active High.
If profit target is not met by 4pm ET, exit on the close of the 4pm bar.

Details:Commission/Exchange fees:$12.50
Slippage:$25
Number of contracts traded:1
Time-frame:3 minutes
Test period: 2007~2010

Results:Number of Trades: 147
Percentage % of winning trades:78.65%
Maximum Draw down: $1137.5
Minimum account size required (including day trading margin): $1637.50
Total Profit::$1787.50
End balance:$3425
Percentage gain:209.1%

Market: E-Mini Dow ($5)
-----------------------
Setup: Go long (buy stop) on a rising 600sma and a breakout of the NH after the 3rd AL on Thursdays in the 3rd week of the month.
The 3rd active low must have a tail (it cannot be part of a double 3 min low).
Profit target:Exit at market if the current open if greater than 30 points above your entry.
Stop Loss:At the prior AL.
Go short (sell stop) on a falling 600sma and a breakout of the NL after the 3rd AH on Mondays.
Profit target:Exit at market if the current open is less than 40 points below your entry.
Stop loss:At the prior AH.
If profit target is not met by 4pm ET, exit on the close of the 4pm bar

Details: Number of contracts traded:1
Test period: 2007~2010
Commission/Exchange fees:$10
Slippage:$10
Time-frame:3 minutes

Results: Number of Trades: 37
Win rate (% of successful trades): 65.01%
Total Profit:$2105
Maximum Draw down: -$1950
Starting balance (minimum account size required) $2450
End balance:$4555
Percentage gain:185.91%


If you are interested you can watch a video of the system on youtube:

3 Year back-tested trading system, peforms modestly well! - YouTube

If you like it, leave a comment on YT, I'd be v. happy!
 

Attachments

  • image.png
    image.png
    24 KB · Views: 319
I've just back tested a couple of simple patterns '3 falling peaks' and '3 rising valleys'. The names are kind of self explanatory. Thomas Bulkowski tested them on 500 stocks, each over a period of 5 years, and found them both to be profitable. Here are the results of my back-test of these pattern with futures:

Market: E-Mini S&P 500
----------------------
Set up: Short on b/o of 2nd new low in trend on Thursdays and Fridays, 1st/3rd week of month.
Long on b/o of 2nd new high in trend, if it has a tail on Thursdays in 1st/2nd/3rd week of month.
Longs require a rising 600sma (current close must be higher than close last week this time (approximately)).
Shorts require a falling 600sma (current close must be lower than close last week this time (approximately)).
Profit: Exit on first open that has a profit of greater than one point.
Stop Loss: At most recent Active Low/Most recent Active High.
If profit target is not met by 4pm ET, exit on the close of the 4pm bar.

Details:Commission/Exchange fees:$12.50
Slippage:$25
Number of contracts traded:1
Time-frame:3 minutes
Test period: 2007~2010

Results:Number of Trades: 147
Percentage % of winning trades:78.65%
Maximum Draw down: $1137.5
Minimum account size required (including day trading margin): $1637.50
Total Profit::$1787.50
End balance:$3425
Percentage gain:209.1%

Market: E-Mini Dow ($5)
-----------------------
Setup: Go long (buy stop) on a rising 600sma and a breakout of the NH after the 3rd AL on Thursdays in the 3rd week of the month.
The 3rd active low must have a tail (it cannot be part of a double 3 min low).
Profit target:Exit at market if the current open if greater than 30 points above your entry.
Stop Loss:At the prior AL.
Go short (sell stop) on a falling 600sma and a breakout of the NL after the 3rd AH on Mondays.
Profit target:Exit at market if the current open is less than 40 points below your entry.
Stop loss:At the prior AH.
If profit target is not met by 4pm ET, exit on the close of the 4pm bar

Details: Number of contracts traded:1
Test period: 2007~2010
Commission/Exchange fees:$10
Slippage:$10
Time-frame:3 minutes

Results: Number of Trades: 37
Win rate (% of successful trades): 65.01%
Total Profit:$2105
Maximum Draw down: -$1950
Starting balance (minimum account size required) $2450
End balance:$4555
Percentage gain:185.91%


If you are interested you can watch a video of the system on youtube:

3 Year back-tested trading system, peforms modestly well! - YouTube
 
Are you sure Bulkowski used a 3-minute timeframe?

147 and 37 trades for a 3-minute interval in 5 years is a non-significant sample statistically.

I also like price patterns but you must nail significance. Doing manual testing is pain. There are programs that will discover these patterns automatically based on your significance levels, like number of trades, profit factor, etc. Check this thread for one. There are others also I 'm not familiar with.


Bullowski used daily data, not 3 minute!!

It sounds like you are suggesting I use a computer program to backtest the patterns. If you are, I should tell you that the results posted are not from a manual back-test, but do in fact come from a computer back-test.

cheers:)
 
Are you sure Bulkowski used a 3-minute timeframe?

147 and 37 trades for a 3-minute interval in 5 years is a non-significant sample statistically.

37 trades not statistically significant....I agree. I think however 147 is ok. The reason for that is really an appeal to authority ~ Henry Carstens a professional systems developer, says that (at least) 100 trades comprising of random samples of the population is sufficient. Alexander Elder states that at least 2 years of data is sufficient. Going back further than 2005 for data, I feel would be pointless, as the ES behaved differently then, much less volume.

I would however concur that it is not complete as a backtest as of yet. A t-Test and optimal f test would complete it.
 
You're curve fitting, any system will appear to work if you do that. For instance what are the results if you do it every week and every day.


I've just back tested a couple of simple patterns '3 falling peaks' and '3 rising valleys'. The names are kind of self explanatory. Thomas Bulkowski tested them on 500 stocks, each over a period of 5 years, and found them both to be profitable. Here are the results of my back-test of these pattern with futures:

Market: E-Mini S&P 500
----------------------
Set up: Short on b/o of 2nd new low in trend on Thursdays and Fridays, 1st/3rd week of month.
Long on b/o of 2nd new high in trend, if it has a tail on Thursdays in 1st/2nd/3rd week of month.
Longs require a rising 600sma (current close must be higher than close last week this time (approximately)).
Shorts require a falling 600sma (current close must be lower than close last week this time (approximately)).
Profit: Exit on first open that has a profit of greater than one point.
Stop Loss: At most recent Active Low/Most recent Active High.
If profit target is not met by 4pm ET, exit on the close of the 4pm bar.

Details:Commission/Exchange fees:$12.50
Slippage:$25
Number of contracts traded:1
Time-frame:3 minutes
Test period: 2007~2010

Results:Number of Trades: 147
Percentage % of winning trades:78.65%
Maximum Draw down: $1137.5
Minimum account size required (including day trading margin): $1637.50
Total Profit::$1787.50
End balance:$3425
Percentage gain:209.1%

Market: E-Mini Dow ($5)
-----------------------
Setup: Go long (buy stop) on a rising 600sma and a breakout of the NH after the 3rd AL on Thursdays in the 3rd week of the month.
The 3rd active low must have a tail (it cannot be part of a double 3 min low).
Profit target:Exit at market if the current open if greater than 30 points above your entry.
Stop Loss:At the prior AL.
Go short (sell stop) on a falling 600sma and a breakout of the NL after the 3rd AH on Mondays.
Profit target:Exit at market if the current open is less than 40 points below your entry.
Stop loss:At the prior AH.
If profit target is not met by 4pm ET, exit on the close of the 4pm bar

Details: Number of contracts traded:1
Test period: 2007~2010
Commission/Exchange fees:$10
Slippage:$10
Time-frame:3 minutes

Results: Number of Trades: 37
Win rate (% of successful trades): 65.01%
Total Profit:$2105
Maximum Draw down: -$1950
Starting balance (minimum account size required) $2450
End balance:$4555
Percentage gain:185.91%


If you are interested you can watch a video of the system on youtube:

3 Year back-tested trading system, peforms modestly well! - YouTube

If you like it, leave a comment on YT, I'd be v. happy!
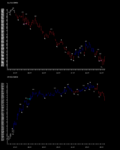
 
Of course you already know the answer, if I run the pattern everyday it is not profitable. I'd disagree with you about 'any system will work if you do that'. I have applied the 'day-of-the-week filter' to several non-profitable systems and it made no difference, they remained unprofitable. So clearly it is not the case that applying this filter can make 'any' system appear profitable.

About curve fitting, perhaps, perhaps not. I intend to run a t-Test which should answer that question.
 
You're curve fitting, any system will appear to work if you do that. For instance what are the results if you do it every week and every day.

Of course you already know the answer, if I run the pattern everyday it is not profitable. I'd disagree with you about 'any system will work if you do that'. I have applied the 'day-of-the-week filter' to several non-profitable systems and it made no difference, they remained unprofitable. So clearly it is not the case that applying this filter can make 'any' system appear profitable.

About curve fitting, perhaps, perhaps not. I intend to run a t-Test which should answer that question.
 
I hope the distribution will form a nice normal bell curve! I haven't run the test yet, I will post when it is complete.

OK t=8.45, based on this it seems that I've found a tradable idea, something real.

I used formula t=square root(n)*(average trade/standard deviation of trades).
 
But you've applied other filters as well, weeks of the month, only certain instruments etc. I remember spending months doing this in easylanguage and there wasn't a single thing that worked until you started curve fitting it. That looked great in backtesting as you can pretend to yourself there really is a reason why it fails a lot on Tuesdays with a Y in the month. Try forward testing it with real money, its a very different story.
 
But you've applied other filters as well, weeks of the month, only certain instruments etc. I remember spending months doing this in easylanguage and there wasn't a single thing that worked until you started curve fitting it. That looked great in backtesting as you can pretend to yourself there really is a reason why it fails a lot on Tuesdays with a Y in the month. Try forward testing it with real money, its a very different story.

I should point out that the week of the month filter does not render the system unprofitable when removed. But the day of the week filter seems to be significant.

The t test seems to verify that the system is real and tradable t=8.45.
Bullowski's 500 stock, 5 year test gives me some confidence in it too.

Of course my next step is to forward test it and apply it to other markets.

Post your forward testing on a new thread - good luck
 
Top