Are all TA indicators lagging?

Roberto

Experienced member
Messages
1,073
Likes
20
Who says there's no such thing as a leading indicator? :)

Yesterday's 30-minute chart of the Euro/USD showed a brilliant example of negative divergence in the RSI. Trading this produced an easy 100-point profit (up to 150 points available with care over entry and exit) in a couple of hours ... (see attached chart).
 

Attachments

  • eur-$-30min-10-11-04.png
    eur-$-30min-10-11-04.png
    9.3 KB · Views: 727
Yeah i find divergence a great way of spotting a move running out of steam. But ii'll still wait for comfirmation in the price.
 
there is a difference between being lagging, and being predictive.

just because an indicator is lagging, doesnt mean it isnt predictive.

after all, that is what they are there for.

however, i am yet to find an indicator that is properly predictive.

for example, virtually all oscillators identify overbought and oversold levels.

how they work, is that they assume that the price will reverse this extreme and return to a more median level.

this return to a median level can take several bars to occur.

therefore oscillators are not predictive. just indicating a "balance of probabilities"

for an indicator to be truly predictive, then it should be able to call the direction of the VERY NEXT BAR correctly the majority of the time.

in the backtests i have done, none of the standard ones come close to calling the next bar more than 60% of the time.

i have created some custom ones based on sine waves, but they occur infrequently, and are only correct about 65-70% of the time.

FC
 
FetteredChinos said:
i have created some custom ones based on sine waves, but they occur infrequently, and are only correct about 65-70% of the time.
"Only", he says! :)
 
lol im just showing that nothing can be truly predictive, as every indicator by definition is lagging.

even price itself is lagging.

the only thing that is predictive is sentiment. and if someone can work out an indicator for that on a short term basis then good luck to them!

FC
 
The only thing that lags is a trader’s competence.

When eventually people stop going with the heard and think for themselves a whole new world appears

Regards
NB
 
I woulnt consider myself mysterious at all I was mearly pointing out what I consider to be a fact. As for a nexus course Ive heard of them, I'm too busy trading

Kind regards
NB
 
Just to set the record straight.

Mathematical indicators neither lead nor lag, regardless of which mathematical indicator is being used.

What they return is the result of a mathematical formula, correct as at ANY moment in time. Nothing more, nothing less.

It is how this information is interpreted and used that may be of value, and not the information itself. To understand and use the information it really does help if people take the time and trouble to understand what is being calculated by an indicator and how it is being calculated. That tends to hold the key to being able to properly interpret and utilise the information the indicator is providing.
 
  • Like
Reactions: Buk
Roberto said:
Who says there's no such thing as a leading indicator? :)

Yesterday's 30-minute chart of the Euro/USD showed a brilliant example of negative divergence in the RSI. Trading this produced an easy 100-point profit (up to 150 points available with care over entry and exit) in a couple of hours ... (see attached chart).

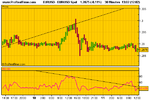
Hi Roberto,

Divergences do not give a signal to buy or sell. They just tell you what may be happening in future but in the mean time, price can go UP a lot before the divergence effect comes in.

How do you determine your sell signal in this case?
 
Newtron Bomb said:
The only thing that lags is a trader’s competence.
When eventually people stop going with the heard and think for themselves a whole new world appears
Regards
NB

It's called being contrarian. But what if everyone was contrarian ?

Long live the herd I say :devilish:
 
All indicators are based on historical data so there's no magic about any of them, any more than there is magic about price charts. They are simply mathematical constructs with price/time/volume and sometimes various numerical measures of sentiment as their parameters. They are alternative ways of presenting information already there in the parameter charts - useful for confirming what you should already be seeing or jogging your perception to see what was staring you in the face but you had missed (wood for trees etc).

But they shouldn't usurp raw price action IMHO
 
I got call from a guy from VantagePoint yesterday.

Apparently, they use previous Highs, Lows, Volume,etc and a whizz-bang neural network, and they have an indicator thas PREDICTs, I say PREDICTs, the future direction of the market with 80% accuracy !!

They have been in the forefront of thsi technology for over 20 years.

He couldnt answer when I asked why he himself hadnt spent the paltry $3,000 or so, and jacked in his sales-job.

Hmmmm.....
 
trendie said:
I got call from a guy from VantagePoint yesterday.

[...]

He couldnt answer when I asked why he himself hadnt spent the paltry $3,000 or so, and jacked in his sales-job.

Hmmmm.....
Lovely :LOL:
 
Top