You are using an out of date browser. It may not display this or other websites correctly.
You should upgrade or use an alternative browser.
You should upgrade or use an alternative browser.
Pat494
Legendary member
- Messages
- 14,614
- Likes
- 1,588
Good question Pat. Do you have an interpretation of what the bars mean? We know what OHLC bars mean, we know what constant volume bars mean but what do Renko bars mean?
I was hoping you were going to tell me, but alas..........
Renko Charts
Introduction
Invented in Japan, Renko charts ignore time and focus solely on price changes that meet a minimum requirement. In this regard, these charts are quite similar to Point & Figure charts. Instead of X-Columns and O-Columns, Renko charts use price “bricks” that represent a fixed price move. These bricks are sometimes referred to as “blocks” or “boxes.” They move up or down in 45 degree lines with one brick per vertical column. Bricks for upward price movements are hollow while bricks for falling price movements are filled with a solid color (typically black).
Construction and Characteristics
Renko charts are based on bricks with a fixed value that filters out smaller price movements. A regular bar, line or candlestick chart has a uniform date axis with equally spaced days, weeks and months. This is because there is one data point per day or week. Renko charts ignore the time aspect and only focus on price changes. If the brick value is set at 10 points, a move of 10 points or more is required to draw another brick. Price movements less than 10 points would be ignored and the Renko chart would remain unchanged.
Using the S&P 500 10-point Renko chart as an example, a new Renko brick would not be drawn if the S&P 500 were at 1840 and advanced 9 points to 1849. If the S&P 500 then advanced to 1850 the very next day, a new Renko brick would be drawn because the entire move was at least 10 points. This brick would extend from 1840 to 1850 and be hollow, or white in this example. Alternatively, if the S&P 500 declined from 1840 to 1830, a new Renko brick would be drawn and it would be solid, or black in this example
Atilla
Legendary member
- Messages
- 21,111
- Likes
- 4,302
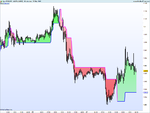
Renko does show the directional trend and cuts out a lot of noise.
Do you use it ?
With mov averages perhaps
This is the S&P 500 daily
fwiw - I use the Three Line Break. 👍
Pat494
Legendary member
- Messages
- 14,614
- Likes
- 1,588
fwiw - I use the Three Line Break. 👍
Thanks - I will have a look.
Yes, it has it's points. It may be better to use the Opening rather than the Close though ?
Last edited:
M
malaguti
Renko does show the directional trend and cuts out a lot of noise.
Do you use it ?
With mov averages perhaps
This is the S&P 500 daily
Occasionally I use it Pat, as you say it makes reading the charts much easier. Depending on the brick size you use however..
I have backtested various methods, using traditional candle and renko and often find renko comes out on top
Just bear in mind though that two renko charts will never be the same, even if we use the same settings as each brick is drawn from the start point of the data set. if that data set is different, our analysis will be different
its a drawback to its method but as long as you are aware of this, it shouldn't hinder your analysis it just makes your interpretation, and mine completely different
You haven't stated the settings you're using, so I can't give an example
if you do, I'll show you my renko for the s&p
Pat494
Legendary member
- Messages
- 14,614
- Likes
- 1,588
Occasionally I use it Pat, as you say it makes reading the charts much easier. Depending on the brick size you use however..
I have backtested various methods, using traditional candle and renko and often find renko comes out on top
Just bear in mind though that two renko charts will never be the same, even if we use the same settings as each brick is drawn from the start point of the data set. if that data set is different, our analysis will be different
its a drawback to its method but as long as you are aware of this, it shouldn't hinder your analysis it just makes your interpretation, and mine completely different
You haven't stated the settings you're using, so I can't give an example
if you do, I'll show you my renko for the s&p
On my version of Metastock there is only the one they supply and no ability to change the settings. I read somewhere that Nilson recommends using candles together with renko. I use Ichi moko rather than candles as they are more informative.
looking for an renko indicator for prorealtime to use with bars like this one for three line break
once t=1
once a0=(close)
once a1=(close)
once a2=(close)
once a3=(close)
if t=1 and close>a3 then
a0=a1
a1=a2
a2=a3
a3=close
elsif t=1 and close<a0 then
t=-1
a1=a3
a0=a3
a3=close
elsif t=-1 and close<a3 then
a0=a1
a1=a2
a2=a3
a3=close
elsif t=-1 and close>a0 then
t=1
a1=a3
a0=a3
a3=close
endif
return a0 coloured by t[1] as "cassure"
Attachments
timsk
Legendary member
- Messages
- 8,908
- Likes
- 3,627
Hi Pat,Do you use it ?
I've had a love affair with Renko for many years now - it's pretty much the only chart I use these days.

The chart above is the Dow, showing a brick size of 50 points. I like the extra granularity of the wicks - which traditionalists don't use - as it helps to show the strength and momentum of a move.
I've never understood why more traders don't use Renko. The clarity and simplicity of the chart is so refreshing: trend and SnR levels scream out at you and you don't have to spend forever analysing the 'meaning' and significance of each brick in the way that users if bar and candlestick charts are prone to doing.
"Just bear in mind though that two Renko charts will never be the same, even if we use the same settings as each brick is drawn from the start point of the data set. if that data set is different, our analysis will be different. . ."
I understand (I think) Malaguti's point, but that same observation could be made of bar or candlestick charts. Take a 5 min chart for example. Instead of starting on the hour with each subsequent candle starting at 5, 10, 15 minutes etc. past the hour - they could start at a minute after the hour with each subsequent candle starting at 6, 11, 16 minutes etc. Doing that will produce a different candlestick chart. With Renko, most software packages will align the data set with major round numbers - as per my MT4 chart above - which goes 50, 100, 150, 200 etc., as opposed to 60, 110, 160, 210 etc. So, while I think Malaguti is correct in what he says, I really don't think it's a problem or a reason for not using Renko charts. Hope that makes sense?
Tim.
Pat494
Legendary member
- Messages
- 14,614
- Likes
- 1,588
Hi Pat,
I've had a love affair with Renko for many years now - it's pretty much the only chart I use these days.
View attachment 188168
The chart above is the Dow, showing a brick size of 50 points. I like the extra granularity of the wicks - which traditionalists don't use - as it helps to show the strength and momentum of a move.
I've never understood why more traders don't use Renko. The clarity and simplicity of the chart is so refreshing: trend and SnR levels scream out at you and you don't have to spend forever analysing the 'meaning' and significance of each brick in the way that users if bar and candlestick charts are prone to doing.
"Just bear in mind though that two Renko charts will never be the same, even if we use the same settings as each brick is drawn from the start point of the data set. if that data set is different, our analysis will be different. . ."
I understand (I think) Malaguti's point, but that same observation could be made of bar or candlestick charts. Take a 5 min chart for example. Instead of starting on the hour with each subsequent candle starting at 5, 10, 15 minutes etc. past the hour - they could start at a minute after the hour with each subsequent candle starting at 6, 11, 16 minutes etc. Doing that will produce a different candlestick chart. With Renko, most software packages will align the data set with major round numbers - as per my MT4 chart above - which goes 50, 100, 150, 200 etc., as opposed to 60, 110, 160, 210 etc. So, while I think Malaguti is correct in what he says, I really don't think it's a problem or a reason for not using Renko charts. Hope that makes sense?
Tim.
Interesting Tim. I just had a look at my MT4 platform and it has no renko or 3 line. I am supposing you bought an extra add-on ?
timsk
Legendary member
- Messages
- 8,908
- Likes
- 3,627
Hi Pat,. . . I am supposing you bought an extra add-on ?
The Renko EA that I use is free to download: Renkolivecharts_pimped_v4_13
It works fine as far as I'm aware although, to be honest, I haven't cross checked it with another chart. Occasionally, the wicks go haywire - usually when one first loads a new instrument - and then it magically sorts itself out! If you're interested in trying this version out, you might like to copy and paste verbatim the EA's name into Google - as there are various YouTube vids about it.
Tim.
M
malaguti
Hi Pat,
I've had a love affair with Renko for many years now - it's pretty much the only chart I use these days.
View attachment 188168
The chart above is the Dow, showing a brick size of 50 points. I like the extra granularity of the wicks - which traditionalists don't use - as it helps to show the strength and momentum of a move.
I've never understood why more traders don't use Renko. The clarity and simplicity of the chart is so refreshing: trend and SnR levels scream out at you and you don't have to spend forever analysing the 'meaning' and significance of each brick in the way that users if bar and candlestick charts are prone to doing.
"Just bear in mind though that two Renko charts will never be the same, even if we use the same settings as each brick is drawn from the start point of the data set. if that data set is different, our analysis will be different. . ."
I understand (I think) Malaguti's point, but that same observation could be made of bar or candlestick charts. Take a 5 min chart for example. Instead of starting on the hour with each subsequent candle starting at 5, 10, 15 minutes etc. past the hour - they could start at a minute after the hour with each subsequent candle starting at 6, 11, 16 minutes etc. Doing that will produce a different candlestick chart. With Renko, most software packages will align the data set with major round numbers - as per my MT4 chart above - which goes 50, 100, 150, 200 etc., as opposed to 60, 110, 160, 210 etc. So, while I think Malaguti is correct in what he says, I really don't think it's a problem or a reason for not using Renko charts. Hope that makes sense?
Tim.
not quite Tim, what period is your Dow chart? or is it tick?
timsk
Legendary member
- Messages
- 8,908
- Likes
- 3,627
Hi malaguti,
Tim.
Which bit?! And do you want me to try and explain it again?not quite Tim,
1 minute.. . . what period is your Dow chart? or is it tick?
Tim.
timsk
Legendary member
- Messages
- 8,908
- Likes
- 3,627
Another freebie that looks interesting (although I don't use it myself) that overlays Renko on candlestick charts and shows you what Renko is doing in different brick sizes: ZIG Renko Charting Suite
M
malaguti
Hi malaguti,
Which bit?! And do you want me to try and explain it again?
1 minute.
Tim.
No as in, not quite what I meant,I was going to expand on my explanation
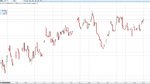
Here's the dow, 1 minute on my chart. I've highlighted where the differences are from yours to mine. Each brick is built from the brick before, and before that, until you arrive at brick 1 many many periods ago. If my starting point was 16000 say, and yours was not then we will always have different looking charts
Now compare that to a traditional candle 1 minute..
here's mine. Is there any difference in your 1 minute candlestick..i wouldn't have thought so as 1 minute is always packaged the same
Attachments
timsk
Legendary member
- Messages
- 8,908
- Likes
- 3,627
Hi malaguti,
Thanks for the clarification and the charts.
Convention dictates that all time divisions (be they 1 minute, 5 minute, 10 minute etc.) start at the 12 o'clock position, but that's an artificial construct that's convenient for us. The market has no knowledge or respect for it. It doesn't know or care that we start each minute at the 12 o'clock position as opposed to the quarter past three position. Former T2W guru dbphoenix used to say something to the effect that the market is a movie - not a series of stills - or something to that effect.
Therefore, I maintain that the differences you highlight between our two Renko charts are small compared to the differences you'd see between two candlestick charts that start at different time intervals - as pretty well every single candle will be different. That's really my key point - hope I've explained it better this time!
😉
Tim.
Thanks for the clarification and the charts.
Yeah, we're on the same page and I understood you correctly in your first post. And I agree with you.No as in, not quite what I meant,I was going to expand on my explanation
Here's the dow, 1 minute on my chart. I've highlighted where the differences are from yours to mine. Each brick is built from the brick before, and before that, until you arrive at brick 1 many many periods ago. If my starting point was 16000 say, and yours was not then we will always have different looking charts
Again, I agree with you. However, our 1 minute charts only look the same because our respective providers (assuming they're different) start and finish each minute at the 12 o'clock position. As you rightly say, they're packaged the same way. However, for the sake of argument, if my 1 minute chart started and finished at the quarter past three position, then our charts will appear quite different - just like the Renko ones do. The highs and lows will still be the same, but the individual candles will vary.Now compare that to a traditional candle 1 minute..
here's mine. Is there any difference in your 1 minute candlestick . . i wouldn't have thought so as 1 minute is always packaged the same
Convention dictates that all time divisions (be they 1 minute, 5 minute, 10 minute etc.) start at the 12 o'clock position, but that's an artificial construct that's convenient for us. The market has no knowledge or respect for it. It doesn't know or care that we start each minute at the 12 o'clock position as opposed to the quarter past three position. Former T2W guru dbphoenix used to say something to the effect that the market is a movie - not a series of stills - or something to that effect.
Therefore, I maintain that the differences you highlight between our two Renko charts are small compared to the differences you'd see between two candlestick charts that start at different time intervals - as pretty well every single candle will be different. That's really my key point - hope I've explained it better this time!
😉
Tim.
M
malaguti
However, our 1 minute charts only look the same because our respective providers (assuming they're different) start and finish each minute at the 12 o'clock position. As you rightly say, they're packaged the same way. However, for the sake of argument, if my 1 minute chart started and finished at the quarter past three position, then our charts will appear quite different - just like the Renko ones do. The highs and lows will still be the same, but the individual candles will vary.
Tim.
not sure I agree Tim. A data provider, provides 1 minute data each minute when that minute has closed. whatever time the market starts each day. at 3.15 I will have 1 minute for 3.14 and another for 3.15 it will be the same high low close etc (depending on data provider) and therefore the same chart.Not so on the renko
Anyway, look its beside the point and I'm not arguing (or were not trying to at least)
I still do use renko and love its construction even though there will be subtle differences and where I see a buy you may not, or if I see an exit you may not
As long we are consistent as you or Split said, its all good
timsk
Legendary member
- Messages
- 8,908
- Likes
- 3,627
Hi malaguti,not sure I agree Tim. A data provider, provides 1 minute data each minute when that minute has closed. whatever time the market starts each day. at 3.15 I will have 1 minute for 3.14 and another for 3.15 it will be the same high low close etc (depending on data provider) and therefore the same chart.Not so on the renko
Anyway, look its beside the point and I'm not arguing (or were not trying to at least)
I still do use renko and love its construction even though there will be subtle differences and where I see a buy you may not, or if I see an exit you may not
As long we are consistent as you or Split said, its all good
From what you say, I suspect you've not fully understood my point - which is entirely my fault for not explaining it very well! Be that as it may, we certainly agree that Renko has its uses and that consistency in one's approach is what really matters.
👍
Tim.
Similar threads
- Replies
- 0
- Views
- 2K