Anyone trading with FTSE T&S ?

One Eyed Shark

Well-known member
Messages
257
Likes
13
Need some help to get my head round this one.

I currently trade most markets except the FTSE future, the main reason being I cant get a grip on order flow and price.

Many times I see the T&S data moving in the opposite direction to price, and this is unusual, it doesnt happen on other markets.

So if we are in a trend up I find that the T&S is showing red and vice versa, sometimes it is pretty much aligned but when we start to trend it goes in the opposite direction.

Any ideas ?????

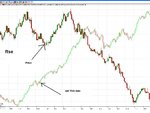
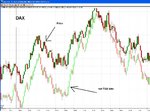
I have posted 2 charts, a FTSE and a DAX, the dark candles are price and the light candles are the net buying and selling from the T&S.

The DAX chart lines up so well, as do most charts for other contracts but not the FTSE
 

Attachments

  • ftse.JPG
    ftse.JPG
    105.5 KB · Views: 389
  • dax.JPG
    dax.JPG
    128.3 KB · Views: 411
I do to


Don"t No............but watching thread one eyed Shark, subject interests me but not very good reader from tick to tick / order book

Who provides that chart , bit like marrket delta charts but looks a better layout or more familer anyway ?


Andy
 
It is a marketdelta chart, just set it up in a way to make it easier to read
 
Last edited:
By T&S im assuming you mean every trader hitting bids or offers....

Its pretty simple, if price is trending up, but T&S is showing red/more people hitting the bid, then it just means offers are being pulled and this price moves higher. The traders who are short from hitting the bids are then short&caught and have to pay up eventually making price move up further.
 
Agree DC.

Problem with FTSE T&S is that it does not correlate at all, so in an uptrend selling increases to the point that the tape bears no relation to the price action.

If you look at the dax, Eurostoxx, bund, bobl etc etc, they perform exctly how you would expect but not the FTSE.

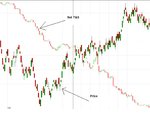
Have attached another chart from earlier today, showing price and net T & S

1. As price rallies you would expect the net T&S to be going up too.

2. Those caught short, will have to cover, further accelerating both price and T & S.

But it does not happen as price rallies selling increases........... ??????
 

Attachments

  • ftse2.JPG
    ftse2.JPG
    79.3 KB · Views: 328
Hi, One-Eyed

Of course, in every sense that it is an anomaly. You should not trade in FTSE Index Future or Future Options as you are not comfortable with it using your own trading methodology.

Would you be interested to take a look at my thread? Well there are certain instances in the European Indices that also offers some challenging anomalies as well. Even the US Indices also are subject to glitches! As you know that human societies are made up of weird creatures!

Remeber that no use of tech analysis can out run the human/ natural way of things! Try to not get in the FTSE should you be uncomfortable with that info derived from the charts/ data!

S K

--------------------------------------------------------------------------------------------------------Hi there

Be one with GOD, so that HE may appoint a deliver for your Soul-HariHaraBramKalki(S K)


Agree DC.

Problem with FTSE T&S is that it does not correlate at all, so in an uptrend selling increases to the point that the tape bears no relation to the price action.

If you look at the dax, Eurostoxx, bund, bobl etc etc, they perform exctly how you would expect but not the FTSE.

Have attached another chart from earlier today, showing price and net T & S

1. As price rallies you would expect the net T&S to be going up too.

2. Those caught short, will have to cover, further accelerating both price and T & S.

But it does not happen as price rallies selling increases........... ??????
 
Top