Hi,
first of all, hello to everyone, I just got started here at t2w a couple of days ago and I've had a lot of bedtime reading to get through! 😀
I've been interested in getting started in trading for a couple of years now but never really done much about it. I've pored over John Murphy's TA bible several times in those 2 years and have started applying what I've been learning to some real data. I thought I'd post a couple of charts I've been studying tonight because I'm having trouble making an interpretation, and was wondering if anyone would be kind enough to (positively) criticise my analysis or make any pointers to the things I have no doubt missed.... I'm charting purely for educational value currently so I'd be grateful for any advice.
Thanks a lot in advance and hi once again, hope to speak to some of you in the future on these boards!
--------
Tamur
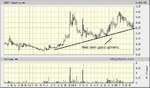
Monthly chart:
What looks like a symmetrical triangle, acting as a continuation pattern which broke out to the downside 4 months ago.
Weekly chart:
The weekly chart is trending gently downwards in a well defined channel. RSI, CMF and Price Relative are all confirming this downward trend. The top resistance line has been broken twice and successfully resisted the last test. The middle line has acted as support twice and was then broken. It remains to be seen whether it will support again but my feeling is prices will drop at least to the bottom line in due course.
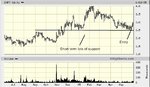
Daily chart:
This is where my interpretation falls over. The chart shows a trend break on heavy volume. All indicators give a positive divergence and suggest prices may well go higher. CMF in particular shows largely diminished selling pressure although it has not yet turned positive which suggests to me that it's too early to make any calls.
The monthly and weekly both say 'DOWN' to me but the daily says 'UP, MAYBE'........ A long on breakout of resistance at 3 seems risky due to further resistance at 3.10, but a short on breakout below support at 2.75 would also seem risky due to the support provided by the trendline below.
Anybody have any comments on this analysis?
first of all, hello to everyone, I just got started here at t2w a couple of days ago and I've had a lot of bedtime reading to get through! 😀
I've been interested in getting started in trading for a couple of years now but never really done much about it. I've pored over John Murphy's TA bible several times in those 2 years and have started applying what I've been learning to some real data. I thought I'd post a couple of charts I've been studying tonight because I'm having trouble making an interpretation, and was wondering if anyone would be kind enough to (positively) criticise my analysis or make any pointers to the things I have no doubt missed.... I'm charting purely for educational value currently so I'd be grateful for any advice.
Thanks a lot in advance and hi once again, hope to speak to some of you in the future on these boards!
--------
Tamur
Monthly chart:
What looks like a symmetrical triangle, acting as a continuation pattern which broke out to the downside 4 months ago.
Weekly chart:
The weekly chart is trending gently downwards in a well defined channel. RSI, CMF and Price Relative are all confirming this downward trend. The top resistance line has been broken twice and successfully resisted the last test. The middle line has acted as support twice and was then broken. It remains to be seen whether it will support again but my feeling is prices will drop at least to the bottom line in due course.
Daily chart:
This is where my interpretation falls over. The chart shows a trend break on heavy volume. All indicators give a positive divergence and suggest prices may well go higher. CMF in particular shows largely diminished selling pressure although it has not yet turned positive which suggests to me that it's too early to make any calls.
The monthly and weekly both say 'DOWN' to me but the daily says 'UP, MAYBE'........ A long on breakout of resistance at 3 seems risky due to further resistance at 3.10, but a short on breakout below support at 2.75 would also seem risky due to the support provided by the trendline below.
Anybody have any comments on this analysis?