You are using an out of date browser. It may not display this or other websites correctly.
You should upgrade or use an alternative browser.
You should upgrade or use an alternative browser.
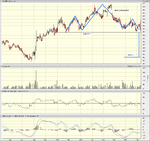
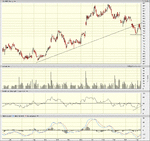
CS is clearly entered a bear market situation. I'd be the looking to trade with the recent trend. I wouldn't be suprised in seeing this stock reach the 30p level over the next few months. Remember to never marry one side of the market as the great Jesse Livermore used to say. Nice to see someone one the UK scene posting charts again.
That's what you would call a representation bias. Just cause it may have done that previously 12months ago, doesn't mean it will happen again. The overall market changes all the time and alot fundamentally has changed since that pattern printed on the charts. Not only that but sentiment has changed too. Try not to look at market patterns in this way. Your eye can find as many patterns you want if you really wanna trade. Have you got a strategy in place? I use MACD and RSI but remember that price is first, the indicators are lagging.
wasp
Legendary member
- Messages
- 5,107
- Likes
- 880
Really just trying to find my Bearings at the moment. I've been reading through the non indicators threads and trying to understand the way things work without using indicators. I've been looking through varioous charts and how the indicators related but I think I might try and ditch them if they are this misleading.
What's is misleading is how you percieve them. Learn the basics of price movement. Dow Theory is essential for understanding what backdrop the market is in. It's the background scenery to the play. The most recommended thread from me is the legendary Des Woodruff. The 'Free Trading Videos' thread is worth it's wait in gold. Study and watch all the videos.
wasp
Legendary member
- Messages
- 5,107
- Likes
- 880
Astrazeneca
one more...
Short in the morning with a soft target at 2,200
Leave trade open if it drops to level - exit if it reverses back up OR stay in if it breaks down, with a new target at 1,850...
Here goes nothing! (well, nearly nothing!) 😆
one more...
Short in the morning with a soft target at 2,200
Leave trade open if it drops to level - exit if it reverses back up OR stay in if it breaks down, with a new target at 1,850...
Here goes nothing! (well, nearly nothing!) 😆
Attachments
Last edited:
wasp
Legendary member
- Messages
- 5,107
- Likes
- 880
barjon
Legendary member
- Messages
- 10,752
- Likes
- 1,863
wasp said:Anyone...anyone at all?
Nobody out there trade UK shares or have any opinions on my obscure theories!?
Wasp
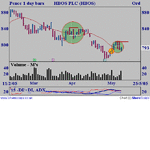
From a slightly different perspective on these three.
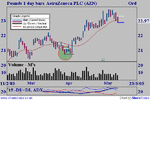
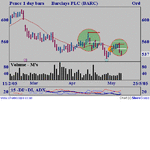
I've been long AZN since 2210 (green circle) and there'll be another long signal if 2329 goes. I'm short BARC and HBOS and you can see where I've had previous nibbles at these (exits in yellow circles).
The AZN and open trades in BARC and HBOS are only half position trades since they were entered against the prevailing FTSE trade.
good trading
jon
Attachments
If contract A is related to contract B and related to contract C.
If A is dependant on indicators X and Y.
If indicators X and Y show that A has reached bottom,
however A is related to B and C,
Even if X and Y show that A has reached bottom, but B and/or C could result in A going further down.
If A is dependant on indicators X and Y.
If indicators X and Y show that A has reached bottom,
however A is related to B and C,
Even if X and Y show that A has reached bottom, but B and/or C could result in A going further down.

