barjon said:
db
I ask because my Wyckoff book (Hutson) seems confusing. It says:
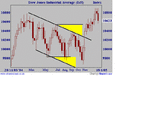
There are four basic trend lines: a support line passing through successive points of support in an uptrend; a supply line - my note: not calling it a resistance line - passing through two successive points of resistance in a downtrend; an oversold position line drawn parallel to the supply line and passing through the first point of support between the supply line's two tops; and an overpassing through the first point of resistance between the support line's two bottoms.
I've always thought of it all as a support line with the line drawn parallel to it as the supply line; and a resistance line with the line drawn parallel to it as the demand line. That not right?
jon
Wyckoff is not always what one would call a model of clarity. He uses demand line, supply line, support line, resistance line, oversold position line, overbought position line, trendline, and, of course, support, resistance, demand, and supply. Therefore, some interpretation is required. Perhaps he didn't anticipate how anal traders would become. But what matters, of course, are the concepts he's trying to get across (remember that he was among the first -- if not
the first -- to address all of this and attempt to codfy it).
Wyckoff does call an uptrend line a support line and a downtrend line a supply line (when it would be more consistent to call them support and resistance lines or demand and supply lines). The overbought and oversold lines are more or less parallel to these.
However, all of this comes from his chapter on The Significance of Trend Lines in the original course, and what he's trying to get across is the nature of trend, trend momentum, trend change and trend reversal. The labels he attaches to all these lines just aren't all that important.
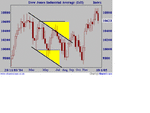
What he is saying, essentially, is that when prices make higher highs and higher lows, one can draw a "trend" line under the lows of these bars or swing points or whatever. I don't call this a support line because doing so would be inconsistent with what he says about support throughout his course. But it doesn't matter. What matters is the fact of the line, whatever one wants to call it, and its angle or "stride".
Once one has this line, he can then draw a line which is more or less parallel to this line and which passes across the tops of the swing point peaks along the way. No, it need not be across the tippy-tops. But it shouldn't be running through the middle of the course like a linear regression line, either. The purpose of this line is to flag those swing points which fail to reach it, which may be a signal that momentum is slowing, which may be a prelude to trend change. As this parallel line is angled downward to track the lower swing points, it will begin to converge with the uptrend (demand, support, whatever) line and, eventually, something will have to give: either the trend line will be broken, or price will find new strength and make a new and higher swing high, restoring the angle of the trend.