roguetrader
Senior member
- Messages
- 2,062
- Likes
- 49
Yes but you have to have a pillow in order to find something under it
Hi Sulongsulong said:If 1 ma is not an indicator, how about 2ma's? Are 2 ma's an indicator?
If not, how about MACD? is that an indicator? it's the distance between 2 ma's.
At which point will a ma become an indicator?
Good point, however, take support for instance. Why does price find any suppport and turn from a downtrend? because either people are buying a lot of stock, or Marketmakers have a lot of stock to sell, so they want the price higher to get a better price. Now, when it comes to a support level, then it's more likely that the reason it's going to bounce up is because people are buying in seeing the support point - that's what is truly providing support.dbphoenix said:Before coming to any conclusions about what provides an edge, one ought to keep in mind that a given event -- such as price seemingly finding S or R at a TL or an MA -- may be only incidental to what is truly providing that S or R
FTSE Beater said:Good point, however, take support for instance. Why does price find any support and turn from a downtrend? because either people are buying a lot of stock, or Marketmakers have a lot of stock to sell, so they want the price higher to get a better price. Now, when it comes to a support level, then it's more likely that the reason it's going to bounce up is because people are buying in seeing the support point - that's what is truly providing support.
JumpOff said:That seems like a slightly TA centric point of view.
Fund managers have to use fundamental analysis. You have to remember a Fund manager can't just get out of a trade, they can't sell a lot of shares very quickly, so they have to make buying decisions based on the "boring" stuff, like PE ratios etc. to make sure a company isn't likely to go bust on them.That seems like a slightly TA centric point of view. Many electronic traders use charts and TA to make purchase decisions, but don't a lot of the bigger funds do fundamental analysis about debt load, profit ratios, new product development, market share, etc...? In the grand scheme of things, those of us who trade by technical analysis alone - without any fundamental knowledge of the underlying instrument - may be a rarity.
What do you think caused the stock market boom in 2000? A lot of the public were buying stock left right and centre.Are you sure we are significant enough as a group to move the market?
So why do market makers go stop running?dbphoenix said:True. The idea that those who move important money do so because of a line drawn arbitrarily by a group of chartists is probably wishful thinking, particularly if few -- or none -- of these movers ever look at charts . . .
I think that explains it better than I could.Joe Ross in The Secret to Reduced Market Spreads in the T2W Knowledge Lab said:One of the primary problems with any kind of trading in the outrights, whether it be in futures or stocks, is that of stop running. The insiders love it when they can see your order. Even when your entry or exit is held mentally, they know where it is. They are keenly aware of where people place their orders. That is why they love Fibonacci and Gann traders. They know precisely where those people will place their orders. The same is true for anyone who uses one of the more commonly known indicators. The insiders fade moving average crossovers, and so-called overbought and oversold—regardless of which indicator is used to show either of those conditions. They know when prices have reached the outer limits of the Bollinger Bands, and they know the location of supposed support and resistance, etc.
I could be wrong about this. However I'm struggling to think of any indicator that is displayed with the chart that could be considered an indicator. 😕Bracke said:Unless I am missing something here, the above surely cannot be correct.
What difference does it make where they or any other numbers or indicators are located. Surely it is about what they are for not where they are placed.
FTSE Beater said:So why do market makers go stop running?
:
dbphoenix said:What I said was "the idea that those who move important money do so because of a line drawn arbitrarily by a group of chartists is probably wishful thinking, particularly if few -- or none -- of these movers ever look at charts ...
dbphoenix said:If you believe that all market makers are looking at the same charts with the same bar intervals and the same MAs and the same BBs and the same trendlines and the same whatever other sort of line you think supplies support and resistance, then I suggest that that is wishful thinking..
dbphoenix said:Which is not to say that I'm right, but the thread does seem to have drifted from the subject of whether or not TLs and MAs provide support and resistance. I maintain that they do not. When I see something other than anecdotal evidence that they do, I'll be first in line to agree. But I anticipate a long wait.
roguetrader said:And what of Hedge funds, or is their money unimprotant money? I have seen countless hedge fund managers refer to technical analysis to time their entry and exit from positions, breaks of long running trendlines frequently lead to significant moves.
I have absolutely no doubt that anyone looking at a daily or weekly trendline in a given stock is looking at the same one that I am looking at, drawing of trendlines isn't exactly advanced technical drawing.
You are quite right but funds who trade on fundamental analysis do not enter a stock at 10am and exit at 10:20, the fundamentals do not change intraday so they do not trade intraday.JumpOff said:That seems like a slightly TA centric point of view. Many electronic traders use charts and TA to make purchase decisions, but don't a lot of the bigger funds do fundamental analysis about debt load, profit ratios, new product development, market share, etc...? )
It would be my view that nobody daytrades based purely on fundamentalsJumpOff said:In the grand scheme of things, those of us who trade by technical analysis alone - without any fundamental knowledge of the underlying instrument - may be a rarity. Are you sure we are significant enough as a group to move the market? )
JumpOff said:I've always thought of TA as a shortcut to understanding or observing market sentiment as it has happened in the past and is happening now. No mark on a piece of chart paper is going to cause a price to move. )
JumpOff said:None us has a car, we must get on a vehicle that we hope will move us far enough along to make it worth our while. )
dbphoenix said:I'm sure that all sorts of people look at all sorts of things. The point is whether or not they are all looking at the same thing. If they aren't, what difference does whatever they're looking at make?
And while I may agree that drawing trendlines is hardly advanced, after 15 years of doing this, I can tell you that you'd be surprised at some of the efforts I've seen. 🙂
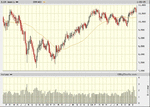
Edit: Drawing back from the abyss of theory and philosophy, let's look at a chart.
At what points does this 40w (200d) SMA provide S or R to the Dow?
Lol I can appreciate that, but I think there's enough money that knows how to draw a trendline.dbphoenix said:And while I may agree that drawing trendlines is hardly advanced, after 15 years of doing this, I can tell you that you'd be surprised at some of the efforts I've seen. 🙂
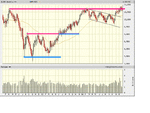
barjon said:db
It doesn't. But, by the same token there's little to suggest S or R at the peaks and troughs of the reaction/retracement. There was, however, a fairly consistent dimunition of enthusiasm and If you draw in the trend line channel you'd be hard pressed not to think that it gave you a clue as to where S and R might be expected.
good trading
jon
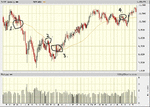
roguetrader said:the importance of moving averages and trendlines for that matter, is not that they are buy and sell points but that they focus your attention to price and volume activity at that point and alert you to an event that may occur. .
Hmmn perhaps I should change my nick to "Lines on charts do not provide support and resistance" I have already pointed out on more than one occaision that lines on charts do not provide support or resistance but that buying and selling does. These lines simply alert us to where this may occur.dbphoenix said:The S/R are provide by those levels at which significant buying or selling has taken place. They are also those levels at which trading activity is most likely to occur. Since these levels are the same on every chart that displays price, no matter who creates it, no matter where he creates it, logically they are far more likely to ignite activity than a line drawn arbitrarily by a relatively few chartists. S/R can't be provided by lines that no one knows are there..
roguetrader said:Alternatively,
Alan S. Farley describes the role of both moving averages and trendlines in his book "The Master Swing Trader" and for those of you who learned their candlestick charting from Steve Nison you will find he refers to both moving averages and trendlines as support and resistance in his book "Japanese Candlestick Charting Techniques"