Best Thread All About Trendlines

Messages
702
Likes
14
Our esteemed FTSEbeater has written:
"Trendlines work because everyone sees them and know that the next time price hits that level, a reversal should happen, so they either rush to buy or sell depending if it is an uptrend or downtrend."

That's my understanding too. I know that if the price is trending up after a BO, I won't buy until it comes down very near to or touching the trendline. (and the opposite for a downtrend) It seems there really is no other safe entry point. I haven't had many successful trading days - but the few times I did, horizontal Support and Resistance 'S&R' and Trendlines 'TL''s both figured strongly in my decisions.

I've heard other folks say this is complete hogwash. For instance Sulong and Dbphoenix are looking at charts on this thread
http://www.trade2win.com/boards/showthread.php?goto=newpost&t=13013
and our extremely esteemed dbp says *again* that TLs do not provide support or resistance.

Anyone want to discuss the hows and whys of TLs? Are they just coincidental, or do they provide tradeable information?

JO
(Edited to fix a former keyboard spasm (*&eO V9 #Wlkj &^% 9&^% )
 
Last edited:
dang it. You can spell check all day, but it won't fix your completely missing typos!
Thanks,
JO
 
You only have to look at a channel (a channel is nothing more than a set of trendlines), whether they be flat, heading up or down, to see the phenomenon.

It is the very existence of (i.e. the fact you can visually identify) the channel that pinpoints S & R levels. The channel IS the S &R levels.

Of course, not all S & R levels are channels or trends. There are many other factors that will establish S &R levels. For instance, previous Highs & Lows in various timeframes will establish useful S & R levels.

To press the point, even a single (but well used) MA such as the 5, 14, 22, 50 or 200 period etc will serve to act as potential S or R precisely because so many traders treat them as such.

You can pick pretty much any chart at random an observe this effect.
 
Sorry guys,

After much study, I'm with dbp on this.

S & R is buying and selling, therefore only price matters, not a line or MA. If all traders used the same MA or lines then there could be preceived S&R, but they don't.

In the majority of cases, its the prices to the left that are significant to traders( how many are up and how many are down, enough to cause a major exodus ?) and therefore influence S & R.

However where these levels and a trendline cross, can give extra confirmation. OTOH where S or R is found before a TL, this also gives you information relating to trend change and strength.

But the great one isn't always right, he can't be, and somewhere somehow I'll prove him wrong.

Someday, maybe,


Porks.
 
OK Porks, no point beating this one to death, but all I'm saying is if we treat Support and Resistance as potential areas for a pause or reversal or continuation (yes, I know I'm covering the entire range of possibilities) - which is how I treat/trade them - then a trendline does serve the purpose of defining S & R. Even a wobbly trendline we call an MA.

If there's an uptrending line which the price has 'bumped' off, retraced from and risen up to meet again more than a couple of times, isn't that potentially tradeable information?

I think maybe the problem some folk have is in their 'need' for S & R to exist ONLY at fixed horizontal price levels rather than to consider them as a potentially dynamic phenomenon.

But just because I choose this perspective or interpretation and manage to trade it successfully, doesn't mean anyone else can or will. I accept that.
 
Beats me how anyone who studies charts with any regularity can fail to see that trnedlines provide support and resistance. Every time? No. But then what in trading works everytime. But that's just my observation, they work for me and that's all I care about. As u say no point in beating it to death.
 
TheBramble said:
You only have to look at a channel (a channel is nothing more than a set of trendlines), whether they be flat, heading up or down, to see the phenomenon.

It is the very existence of (i.e. the fact you can visually identify) the channel that pinpoints S & R levels. The channel IS the S &R levels.

Of course, not all S & R levels are channels or trends. There are many other factors that will establish S &R levels. For instance, previous Highs & Lows in various timeframes will establish useful S & R levels.

To press the point, even a single (but well used) MA such as the 5, 14, 22, 50 or 200 period etc will serve to act as potential S or R precisely because so many traders treat them as such.

You can pick pretty much any chart at random an observe this effect.


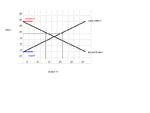
mmm, isn't a channel just a rising rectangle? The old supply and demand lesson from first year economics seems to explain both well enough.

You will see that when the price is at the resistance level there's a maximum number of sellers who want to sell but there are no buyers - ergo the sellers must offer down to attract buyers and at each step there are fewer who want to sell at the reduced price and more who want to buy til you get to the opposite extreme (support) where everyone wants to buy but nobody wants to sell.

At a price of 40 you will see there are about 12 buyers and 20 sellers willing to trade - I've not drawn the scale properly but you get the idea. The crossover point where buyers=sellers at halfway 'twixt support and resistance maybe explains why fib50% works when you think of a channel as a rising rectangle.

For me the lesson points up one of the problems in working with volume. Volume bars tell you a lot about supply and demand at a given price but little about what people waiting in the wings want to do - but that's another story for a different thread :)

good trading

jon
 

Attachments

  • econ.gif
    econ.gif
    4.6 KB · Views: 1,567
Are you trying to wrong-foot me by agreeing with me in a way that doesn't directly relate to what I was saying or disagreeing in way which I can't respond to for the same reason? :LOL:

(Please don't answer "Yes." because that simply wont be very funny - either...)
 
barjon

"isn't a channel just a rising rectangle? "
Isn't that like saying that a circle is a straight line drawn at 360 degrees!

I was under the impression that a support or resistance level was a point at which the price had reached on more than one occasion and had moved away from it. By its form a trend line will not permit the price to hit the same point more than once. That is unless we are prepared to accept that a base or rectangle is a horizontal trendline in which case we are getting into semantics which I do not want to do.

Regards

bracke
 
bramble (bracke)

I'm agreeing with you (I think :LOL: ).

If you accept the somewhat simplistic supply/demand diagram then a rectangle comes when a stock is ranging between two points as described. If the stock is trending sellers disappear at a slightly higher level than they did before and eager buyers must bid up - hence the support (demand) price point line rises. The resistance (supply) point line rises to a similar degree - hence a channel which could be thought of as a tilted rectangle since the same supply and demand forces come into play to result in those patterns.

If people are consistent in their optimism for a stock the trend line shows where support (in the sense of the diagram of no sellers but plenty of wishful buyers) might show itself. Clearly, that support must be much more tenuous than the ranging (rectangle) scenario where the support has shown itself several times.

good trading

jon
 
Delicious

Thanks guys - I threw that out last night and it was great to have something to sink my teeth into this morning with my first cup of java. It felt just like a chocolate Eclair.

JO
 
bracke said:
[
I was under the impression that a support or resistance level was a point at which the price had reached on more than one occasion and had moved away from it. By its form a trend line will not permit the price to hit the same point more than once.
bracke
By this analysis I would assume that you do not regard any moving averages as a form of support or resistance. If that is so then nothing much I can say, however if you view say a 200 sma as a form of support or resistance then you would have to re-assess your need for price to be the same since in many cases price at various points along such an average will not be the same.
 
roguetrader said:
By this analysis I would assume that you do not regard any moving averages as a form of support or resistance. If that is so then nothing much I can say, however if you view say a 200 sma as a form of support or resistance then you would have to re-assess your need for price to be the same since in many cases price at various points along such an average will not be the same.

My understanding is that a moving average is not a support or resistance level but is an indicator.

If we are to accept that a moving average provides support/resistance then surely we must attribute the same to many other indicators; which I accept traders do but would they say that the indicators used are true support/resistance levels.

Regards

bracke
 
bracke said:
My understanding is that a moving average is not a support or resistance level but is an indicator.

If we are to accept that a moving average provides support/resistance then surely we must attribute the same to many other indicators; which I accept traders do but would they say that the indicators used are true support/resistance levels.

Regards

bracke
Interesting concept which I thank you for sharing, unfortunately I am not really clever enough to debate this with you. Since I do not use indicators I have no means of comparison. All I can say in reply is that I regard certain moving averages as support and resistance, the longer the period, the more significant, likewise trendlines

Bottom line I guess is, does what you use a particular tool for do the job you use it for. If so fine.
 
Last edited:
Whether on not TL's provide resistance or support, would everyone agree that they still provide crucial trading information? Is there any better way to visualize changes in momentum?

JO
 
Hi All

JumpOff said:
FTSEbeater has written:
"Trendlines work because everyone sees them and know that the next time price hits that level, a reversal should happen, so they either rush to buy or sell depending if it is an uptrend or downtrend."
Now that's going back a bit, and I still standby it for the reasons that TheBramble and Barjon have made.

I think this is the killer question:
JumpOff said:
Whether on not TL's provide resistance or support, would everyone agree that they still provide crucial trading information?
The answer is yes, well I would say that ;)
What are we using TA for? Well, to get an edge in the market.
Do trendlines give you an edge? Yes. Chris Manning suggested that a channel is between 93%-97% likely to continue. Personally I find that rather high, but I'm sure there is some statistically way of proving it. :confused:
I think 70% is more accurate. Now if I buy in based on the bounce off of a trendline and put a stop just below the last turning point, is the stop below the trendline or a support level? Both really, although I feel it's the trendline. Say the price does move up, where is the stop now? Surely underneath the Trendline is the most useful place.

I suppose what I'm saying is that I believe a trendline gives me an edge. Is it 100% accurate, nowhere near. Do I need it to be 100% accurate to make money? NO!!

Bracke said:
My understanding is that a moving average is not a support or resistance level but is an indicator.
Moving averages aren't indicators, as they don't indicate anything. All Moving Averages show is the average price over a period (which your eye can pick up much better than any MA). The 200ma support / resistance line has been created by the media. You here basic TA'ers talking about the 200ma on television programmes, the public then pick up on this information and go buying or selling accordingly - That's why longer term MA's work.

This is a brilliant debate, and I'm happy to debate it until the cows come home.

PS: Barjon - I haven't seen that Demand & Supply graph since my economic school days. :eek:
 
Having given this some more thought during todays trading, no line on a chart is support or resistance, they merely point us to where support and resistance may occur. Support and resistance is caused by one of two things, buying or selling. The lines we draw on charts simply alert us to where likely decisive buying and selling may occur, a close study of the tape and price action at these points tells us if support or resistance exists here.
 
FTSE Beater said:
Hi All

Moving averages aren't indicators, as they don't indicate anything. All Moving Averages show is the average price over a period (which your eye can pick up much better than any MA).

If 1 ma is not an indicator, how about 2ma's? Are 2 ma's an indicator?

If not, how about MACD? is that an indicator? it's the distance between 2 ma's.

At which point will a ma become an indicator?
 
Before coming to any conclusions about what provides an edge, one ought to keep in mind that a given event -- such as price seemingly finding S or R at a TL or an MA -- may be only incidental to what is truly providing that S or R. The money under the pillow is not evidence of the existence of the tooth fairy, and spring will arrive regardless of whether or not the virgin is tossed into the volcano . . . :)
 
Top