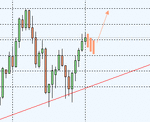
Advice Please: Is this a good short setup?

davidinuk

Newbie
Messages
6
Likes
0
http://chart.ly/r2qq8kv

I am thinking that this is a good setup for a short.

As a newbie, I'd be extremely grateful if there were any members who would be so kind as to confirm whether they think I am correct, and if yes, why, or vice versa!!

Thanks a million!
 
well based on a the descending trend line and the continuation of a down channel.... yes, however it's all based on interpretation. MACD has just turned up and your RSI is not overbought so I wouldn't call it a strong short, but one to put on my short list nonetheless. I'm actually long based on a triangle pattern with a stop loss set. If we don't break through, I'll exit shortly.

http://screencast.com/t/37qdKRMDB
 
There is no clear resistance there aside from your diagonal lines. I would pass on this if it were me.
 
It has potential but the last 4 candles are green, macd is pointing up, RSI over 50...I wouldn't short it until I see some confirmation that it's headed back down.

Peter
 
Thanks to all of you 4 your advice.

Incidently, it did finally work out although it is now stuck at the bottom of the tramline (which I had not noticed before) , looking like it's going to bounce off it.

http://chart.ly/jlnnr9n
 
Sorry, only just saw this thread.

I would have posted that I wouldn't short but expect it to have problems making new highs because others will be shorting. I would expect it to struggle around this level, making a bull flag before heading further north. The trend is up on the daily chart if you zoom further out; so any move south is only likely to be good for 20-50 pips as you won't be the first person to have spotted the bear channel you drew; so you could trade it if you're fairly nimble especially as it reached the top of the channel late in the day which means it might only have fallen 30 pips and bounced around these levels. It is therefore a risky trade if you're looking at the daily charts and using 100 pip stops and why I didn't take the trade. I'm looking to see one or two red candles today and Monday then will buy subject to any fundamentals over the weekend ("Greece has blown up and 50 million public sector workers have been turned inside out!").

Potential chart attached.
 

Attachments

  • eurusd-010711.gif
    eurusd-010711.gif
    4 KB · Views: 290
Last edited:
Sorry, only just saw this thread.

I would have posted that I wouldn't short but expect it to have problems making new highs because others will be shorting. I would expect it to struggle around this level, making a bull flag before heading further north. The trend is up on the daily chart if you zoom further out; so any move south is only likely to be good for 20-50 pips as you won't be the first person to have spotted the bear channel you drew; so you could trade it if you're fairly nimble especially as it reached the top of the channel late in the day which means it might only have fallen 30 pips and bounced around these levels. It is therefore a risky trade if you're looking at the daily charts and using 100 pip stops and why I didn't take the trade. I'm looking to see one or two red candles today and Monday then will buy subject to any fundamentals over the weekend ("Greece has blown up and 50 million public sector workers have been turned inside out!").

Potential chart attached.

Thanks so much 4 ur response. Indeed to all of you!!!

shadowninja:

Indeed, that's exactly what happened. It fell down to 14467, found support at the trendline and went up again. I should have set a limit order at the trendlline, but was greedy and relied on a trailing stop instead, in the vain hope that it would break through the rising trendline, which it tried to, but didn't! So my gain was limited.

The thing I find interesting is that it has hit resistance since 5PM yesterday at around 14538 and that is the level on my first chart. As I write this morning, it is falling away from it's third attempt to break though it.

On the hourly chart, there are 5 large candles on both the reds and greens. Would I be correct to read this as a thus far undecided tussle over which will win, the upwards trend on the hourly, or the longer term resistance on the daily (off my first chart)?

http://chart.ly/jw8gc74
 
I don't tend to use trailing stops apart from to automatically get the stop to break even when I see a decent amount of profit (it's quicker to set the trailing stop to be "profit - default options on MT4" eg "56 - 54" moves it to "breakeven + 2" than to type a specific stop level because I'm a lazy *******). Then I would look to either close most or all of the position or wait if I think the level it is attempting to break can be broken (if the price is moving rapidly then great).

I tend not to look at trendlines on anything below daily but that's just me. I do end up waiting a long time for set ups but usually it's worth the wait.
 
Top