Adventures with Chick Goslin - Trading Day by Day

ardhill

Well-known member
Messages
263
Likes
4
Hi

This really is a thread continuing from the review on Chick Goslin's book "Trading Day by Day"
http://www.trade2win.com/boards/showthread.php?t=12501

I had started looking at a trade using his system, but though that it would be more appropriate on a thread in this part of the forums, thus I started afresh.

Anyone else who wants to add their ideas (based on Chick's book or general market dynamics) is most welcome. Or just put up your own trades and reasoning based on his 'system'.

I have entered a few trades now based on Chick's method, and have to say that at the moment, I am quite happy about it. As you will know, his system is a general guide, but you still have to make decisions along the way, so things can still go belly up on you (well on me anyhow).
 
I saw CIEN about a week ago, and was monitering it. Ciena Corp trades on the Nasdaq and is a low prices stock, but still has reasonable volume generally.

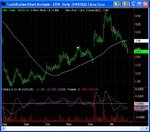
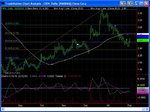
It looked good to me as it was shaping up as far as 'the lines' were concerned. The 49/50 SMA was looking good to start turning down - actually with the margin of error taken into concideration it was already down, the price action was down, the ML was below 0 and down, SL was below 0 and flat.

A couple of days later...


31 Jan - I saw on the 30min chart that the action to the downside was hotting up again and decided it was time to take my short. I entered the market @ 2.53, Initial stop @ 2.83

---

1 Feb - The next day was an up day in the markets, the Dow, Nasdaq and S&P were all up, but CIEN went down :) Even against the market rally, my short entry went south - just want I wanted to see. :D
 

Attachments

  • CIEN-27-01-05.jpg
    CIEN-27-01-05.jpg
    62.5 KB · Views: 1,080
Last edited:
Today 2 Feb


Ok, If i was trying to look good, I would have forgotten about this trade and found a better one to talk about on this thread, but I am being honest here, or maybe just dumb :)

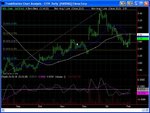
I had realised that the stock had been declining for a while without much of a pullback, and to be honest, I was expecting one - just not quite so soon after I shorted the stock.

Status - Neutral, TL flat, ML below 0 but pointing up, SL, below 0 and pointing up.

Today was a Fed Day, there was a federal reserve meeting, and 4 of the last 5 of them that had a interest rate increase, all caused a market rally - just like today :(

But, President Bush is to give his State of The Union Speech tonight (and it in a pretty bad state) so maybe that will put a dampener on the last few days rally in the markets.

CIEN went up, but not too far, it is till really in a consolidation period, and did close below the overhead fib level.

So, I didn't really want it to rally, but I am not overly worried at the moment, I think poor entry timing rather than a poor judgement call on the direction of the stock, but time will tell [bite nails in anticipation].

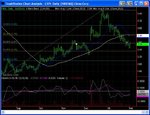
To give you a better idea of what's on the chart, there is Chick's indicators with a 50 SMA (White Line), Fibonacci retracement levels, and a 20 SMA (Blue Line). The flat dotted white line just above 2.80, is the position of my Stop Loss.
 

Attachments

  • CIEN-02-02-05.jpg
    CIEN-02-02-05.jpg
    78.1 KB · Views: 775
A little more explanation on the chart

For those of you who think that Fibonacci is just a load of old rubbish, just think of the lines as support and resistance levels, really that is what they are. It just often happens that S/R levels fall on fib retracement lines.

The little dots above the prices on the chart (there are three of them) are 3, 14 and 50 days back. There are just to help me identify where I can look for my margin of error. The three colours of dot relate to the three colours of lines. If you have read the book, you know what I am talking about - hopefully.
 
ardhill said:
. If you have read the book, you know what I am talking about - hopefully.

I have read the book , but probably need to go over it a couple more times. Does the book not refer to divergence? That is maybe what you have right now. The SL is going up. The ML is up and the 50 average is flat?

erie
 
erierambler said:
I have read the book , but probably need to go over it a couple more times. Does the book not refer to divergence? That is maybe what you have right now. The SL is going up. The ML is up and the 50 average is flat?

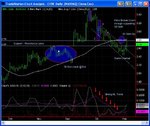
Divergence, as far as I am aware, is more to do with the ML or SL and the previous price action. One of the indications that appealed to me about this trade was a Bearish Divergence on the chart between the two lows on the SL, against the price action (marked on this chart). The price on the chart are slightly higher than each other, the corresponding lows on the SL are lower though, indicating a bearish divergence and lower prices to come - which we have seen. I believe a divergence on the ML would be an even stronger signal.

If you look at the book at some of his live examples, you will see that at times he is in a trade with the same sort of pattern as I have (though for long trades), but the ML and SL are not going the 'right' directions. This does not take him out of the trade, other factors such as price action or an extreme move in the lines would take him out.

He does also mention crosscurrent trades. He does not advise entering trades that are crosscurrent, but trades may become crosscurrent when you are in them. This doesn't necessarily mean that you need to exit.

This is my understanding anyhow.

I know that today's action doesn't look too good, but I don't think I can assume that it is a change of trend just yet.
 

Attachments

  • CIEN-27-01-05-2.jpg
    CIEN-27-01-05-2.jpg
    57.7 KB · Views: 836
ardhill said:
This is my understanding anyhow.

I know that today's action doesn't look too good, but I don't think I can assume that it is a change of trend just yet.

Good luck to you

erie
 
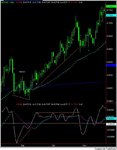
It can be tough if the price is a steady grind down as this has been the case with cien. In these cases you just need to make the best case you can and get on board. With solid steady (non volatile) patterns you will end up with the ML becoming unreliable in detecting swings, mainly because, well, there aren't any swings :) SL will tend to steady and divergences become less useful. until you get some wiggling of the price other then straight down. What I like to do when this is the case is drop down to a lower time frame to get a better feel for entry and position with a solid ML cycle. Because you are trading off daily, maybe dropping down to 120min or 60min would be useful for that. Dunno - just an idea that I use with currencies.

Here as an example of what I mean with the kiwi dollar recently. Also note the bullish divergence in the SL before the sustained move and how the bullish divergence is just prior to a new ML cycle. These little hook backs are frequent and are money for jam when a sustained ML cycle is clear IMHO.
 

Attachments

  • nzdusd_daily.jpg
    nzdusd_daily.jpg
    69.3 KB · Views: 760
Thanks S-A, I know that you trade this system and and one of it's advocates.

My entry was actually preempted by the 30min chart, which was strongly bearish and concurrent before I entered this trade. The next day was great as it continued to drop. Then yesterday happened, and now today happened :(

I will get back at the end of the trading day after I finish crying and decide if this is over or if it is the end of the expected short term pullback.

I am going to huff now, the markets generally are tanking and CIEN is having an up day :cry:
 
OK, end of today, lets see what has happened.

Status - Neutral. TL is flat, ML is below 0 but slightly up, SL is up and below 0.

I must admit, I would have liked to see the TL heading south by now, but if you take the margin of error into consideration - it is. The stock rallied some today, which was sad since the general markets had a down day.

It is certainly a pullback now, and possibly heading to meet the 20 SMA. There may be another day or two of 'not downward' movement as it meets the 20 SMA, though todays upward move was weaker than yesterdays, so that is some sign of a lack of upward strength.

I don't think that the picture looks all that bad, a move to the 20 SMA would be 'normal', it's just a pity it happened so soon after I entered the trade. I would be hesitant to pull the trade prematurely, as it is not looking too bad, and I do have a real stop in place at 2.83. I believe if that stop is hit, it will be a sign that the downward trend isn't going to hold. It is just above an overhead Fib (S/R) level and above a consolidation pattern.
 

Attachments

  • CIEN-03-02-05.jpg
    CIEN-03-02-05.jpg
    78.7 KB · Views: 448
And CIEN is Toast!

Trend out of control and stoploss hit. Ah well, you can't win them all.
 

Attachments

  • CIEN-04-02-05.jpg
    CIEN-04-02-05.jpg
    78.4 KB · Views: 467
ardhill said:
And CIEN is Toast!

Trend out of control and stoploss hit. Ah well, you can't win them all.

sorry that trade didn't pan out ardhill. I've been considering the application of Chick's system to stocks and I wonder whether an adjustment of the determinant of trend might be in order. Stocks don't seem to be as trendy as futures as a rule unless the fundamental case is compelling (see apple) so I wonder whether a slightly shorter preferably exponential moving average say 44 might be a better determinant of trend for the system when applied to stocks.
Just a thought.
 
ardhill said:
And CIEN is Toast!

Trend out of control and stoploss hit. Ah well, you can't win them all.

Ardhill

I'm confused...........trend is out of control????.......The 50 average has been up. It became flat during the retracement. The second law states that continuation is more likely than change. When the divergence was indicated ( after price retraced for a while ) , this (to me ) was the time to buy. How long price will continue is unknowable so I wouldn't look to buy now. ( too late). Can you explain your definition of trend here?

erie
 
erierambler said:
Can you explain your definition of trend here?

Well, I can explain why I thought there was a downward trend.

As you know, and as Chick reminds us, we are not trading indicators, but price. My definition of trend comes much from the price action as I believe it was just moving into a downward trend and the lagging indicators hadn't quite caught up, though there is also indicator conformation as spoken about by Chick.

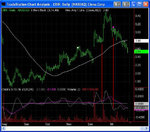
I will just make these quick pointers, you can see what I mean on the attached chart:

  • Price broke down through S/R lines indicating weakness.
  • Price in downward trend channel.
  • 1-2-3 formation with following downward move
  • 50 SMA does physically turn down (just)
  • With Chick's 'Margin of Error' the TL is likely to go down even further and can be considered Bearish
  • ML in strong downward trend, compare it to the gentle rise of previous up move (October to end of December)

I hope this helps you see why I considered it a downward move. But hey, I ain't perfect and that one didn't work out.

Good trading.
 

Attachments

  • CIEN-Trend Indications.jpg
    CIEN-Trend Indications.jpg
    74.9 KB · Views: 624
jcwonder8 said:
sorry that trade didn't pan out ardhill. I've been considering the application of Chick's system to stocks and I wonder whether an adjustment of the determinant of trend might be in order. Stocks don't seem to be as trendy as futures as a rule unless the fundamental case is compelling (see apple) so I wonder whether a slightly shorter preferably exponential moving average say 44 might be a better determinant of trend for the system when applied to stocks.
Just a thought.

Hi

I have been thinking something similar myself.

Not the comparison between futures and stocks, I don't have a futures feed so can't comment on the trends there. I have been looking at the system with the sort of stocks I like to trade i.e. Nasdaq stocks, and yes, by the time the trend is established by the 50 SMA in the Nasdaq, it can quickly change.

I have though made a few successful trades with this system, and made some money so it isn't all that bad. Though as I mentioned on this thread, I think my timing was a little wrong on this trade - probably too quick getting in. I was quick because of the lag thing we have just been thinking about.

Anyway, I have also been looking at that situation and am trying a few things, but not getting away from Chick's system too far as it does have a lot going for it. I am not ready to mention my ideas as yet as they are in early stages ie they need a little move chart time to see if they really can work, then some trades to see how it happens in real time.

But as I said, I like this system and the rest of the material in his book.
 
ardhill said:
Well, I can explain why I thought there was a downward trend.

As you know, and as Chick reminds us, we are not trading indicators, but price. My definition of trend comes much from the price action
I hope this helps you see why I considered it a downward move. But hey, I ain't perfect and that one didn't work out.

Good trading.

Thanks for taking your time to explain. From what I had read in his book , the 49 ma (or 50) was the trend. The dot you have indicating 50 days previous is where one could assume support to be found.(looking at price and a consolidation period). The ML found support there with a divergence showing on the SL. Hey just my two cents, I like the exercise, no one is really right or wrong, it's just our interpretation , and appreciate the discussion.

Good trading to you as well,

erie
 
erierambler said:
no one is really right or wrong, it's just our interpretation , and appreciate the discussion.

In this case, the market said that I was wrong, and there is not much point arguing with the market.

The discussion, is why I started this. Since a number of people on T2W had read the book, I wanted to take a live trade to talk about it.
 
Cien

I know Chick says he goes on the price but it may be of interest to note that :
A director (John R. Dillon) "left" yesterday
The price has been over $6 in the last year
M & A rumours with Cisco and Lucent
I think this share is largely driven by news
 
Have a look at this link
http://fibonaccitrader.com/
I've attached it because on the site there are some free articles about how Gann defined trend which i think may be useful. It seems to me that Goslin's system might be improved for stocks by a better definition of current long term trend or at least by requiring two confirms of trend - Gann style and 50 MA though I'd still definitely consider shortening the 50 MA for stocks and making it exponential. On the basis that stocks are more unpredictable than futures and that relying solely on the 50 MA to determine trend is going to miss the early big moves and also be a hostage to fortune when you are trying to determine whether trend has moved against you.
I haven't had the chance to research this but thought you might be interested as you are looking at refining this aspect of his excellent system.
 
New Trade Taken Today

Hi

I took this trade today using Chick Goslin's system (as described in "Trading Day by Day")


Hecla Mining (HL) Nasdaq

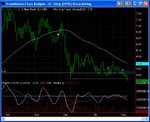
Status - Bearish, -3 points

TL down in established trend, ML down and below 0, SL down and below 0

I decided to go for an established trend this time, and not try and get in at the start of a move, going with the idea that continuation is more likely than change (I am being very restrained).
So we are in an established downward trend.

The price action has been going down and the lines are trending down nicely.

I took the short trade today when the price broke lower than the low of 8th December, you can see by the long dotted white line when I entered my short. The solid blue line above it, is a previous major S/R line, which is why the stock has been consolidating about it. Note that I waited till we broke through that too.

The short dotted white line above that is my initial stop.

Entry Price - 5.29
Initial Stop - 5.51


Constructive comments, thoughts and help are welcome.

Just a reminder, I am no expert in this trading style, nor can I be trusted to give any trading advice. If in doubt, just look at the losing trade above :) I am doing this as an excersise for myself, and anyone else interested in this trading style.
 

Attachments

  • HL-07-02-05.jpg
    HL-07-02-05.jpg
    67.2 KB · Views: 472
Top