A Price Pattern To Trade

rtsurvivor

Member
Messages
53
Likes
2
I've spent a lot of years trading price patterns. The only real trick to making successful trades is to make sure the pattern has a couple of reliable indicators that support the pattern.

There are really only a few basic price patterns:
  • Bull flag
  • Bear Flag
  • Ascending Triangles
  • Desending Triangles
  • Support/Resistance
  • Head/Shoulders Top
  • Head/Shoulders Bottom
  • 1-2-3 -UP
  • 1-2-3 - Down

These patterns can be found on almost all of the time frames.

Here is a strategy I've used for years.
  1. Determine Trend
  2. Look for patterns in the direction of the trend.

It's really not that difficult. Then too, it's not fool proof. :whistling

Money management is a must for every trade. :mad:

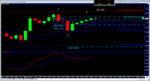
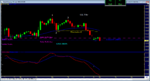
I scanned a couple of currency pairs today and found the USD/CAD had a real classic.

Here's a shot of the pair.
123dn.jpg


As you can see you can actually determine a target for the Breakout from #2

A Stop-Loss should always be factored in.

I'll see what I can come up with for the other patterns a bit later.

Til then. good trading
RT... :smart:
 
Nice picture. I am curious how you determine your target on your 123's? And also if you wait for price to break the #2 level before entering?

I have attached a 123 trade where I entered at the #3 point. If you draw a Fibonacci retracement and set only a 200% line, that gives me my projected target for the 123.

You can see in the picture my entry at the #2 point as well as my two limit orders at the blue line.

You sound like you have a lot more experience than I do and I am curious of what you think about trading a 123 like this and how you see the market.
 

Attachments

  • 2010-06-03_3hour_123_.png
    2010-06-03_3hour_123_.png
    70.3 KB · Views: 395
  • 2010-06-07_3_hr_limited_out.png
    2010-06-07_3_hr_limited_out.png
    72 KB · Views: 345
I use a rule of thumb for measuring a target.
The difference from 1 to 2 sets a target amount
and then, if it's a 123 Down: #2 - Target Amount = Down side estimate.
And for a 123 Up it's just the reverse. This usually holds true if the 123 is a fairly good sized move.

Keep in mind that theses are just estimates. Nothing is ever cut in stone when it comes
to trading. :rolleyes:

As far as the enter price I will put in a 'Buy Stop' or 'Sell Stop' GTC and it's based on the #2 point.

I can't remember the last time I used a 'LIMIT' order. When going long it is sort of like trying to catch a falling knife. :cool:

ie: You know for certain that price will rise at 1.02465, and price is currently at 1.01160 and moving down, so you Buy-Limit 1 lot at 1.01105 because you have a gut feeling that it is going to turn around. You get a fill. If it turns around and goes up then a good trade. :clap: But what if it continues down? OOPS!:cry:

Good trading
RT...
 
Last edited:
Can I ask how you determine Trend ?

Thnks

With pattern trading it is important to know the trend. So, this is what I use.

If I'm trading the 1 hour I will check the 4 hour and Daily. If they are in an up trend I will trade only 'UP' pattern in the hourly. And, if the trend in the two time periods is down you would of course trade only 'DOWN' patterns.

This same strategy holds for other time periods. ie:
15 minute then check trend in 30' and 1 hour.

The rule of thumb is "Don't buck the trend" "Trade the Trend" and if prices are going sideways then stand aside.

This is what I use. It doesn't mean that it's cut in stone. It just means that it works for me. :cool:

RT...
 
can i use zigzag indicator to fine 123 perter

I'm not that up on ZigZag patterns. It sounds like the Elliot Wave theory.

Pattern trading is actually an art form. With a bit of practice you can pick out a winning pattern. However, there is a hard rule I do not violate. There has to be at least two supporting indicators that favor the outcome of a pattern. The Stochastic and MACD come to mind.

If there is convergences and not divergence then I would favor trading the triangles and Flag patterns. The 123 is usually at the bottom or top of a trend so a divergence would be called for. This one also holds for top and bottom head and shoulders.

If there is strong divergence at the completion of a 'Top' head and shoulders then go for the gold and short it at the 1st opportunity. This will of course hold for a bottom pattern.

A bit of practice and it almost becomes 2nd nature. Good trading. :whistling

RT...:cool:
 
Top