a free gift to total newbies from MajorDutch

I think a good idea would be to elaborate on those 7 trades and explain what happened and why it happened. If the pinbars/outside bars are just pixels on your monitor then what is it that the total newbies are actually looking for?

exactment
 
I think a good idea would be to elaborate on those 7 trades and explain what happened and why it happened. If the pinbars/outside bars are just pixels on your monitor then what is it that the total newbies are actually looking for?

I do trade the usual pin bar trash myself but I look for other things before those bars.

they weren't trades/strategy just a price observation. Just looking back at the chart I would have only considered 1 or possibly 2 of the bars as potential trades and that is without conducting further analysis that I would have made at the time. I am not going to go into further details of how I trade as this would just result in further flaming.
 
@WSW87 Personally I think your average (i.e. no statistical analysis) TA punter has a limited shelf like and that is the reason why I'm in the camp that like to know wtf is going on.

For instance, you can punt that bar short and crack on about it until the cows come home but if it would have failed, what would you be saying now?

the average TA punter does have a limited shelf life, the average retail trader has a limited shelf life full stop. whatever the failure rate is I don't know but it's high.

I could try and show you that it is possible to trade using candles as triggers by way of live example. I will look out for some live examples but be aware you may have to wait as I am patient, very patient and I aint gunna serve up something half baked. I am probably on a hiding to nothing.
 
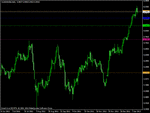
right I didn't have to wait long for to give an example of what I am talking about. Here is a daily chart of AUDDKK the daily bar has just closed 11pm London on my feed. It's an outside bar at a big round number (6.0000) but that's not the point because it's not the bar that moves price. The point is this set up looks great in the context of overall price action. Why do I like this setup:

1. The bearish outside bar is at a swing high.
2. The bar is of good size compared to previous bars (this is discretionary)
3. The trade has plenty of 'space'. difficult to describe in words. there is no immediate chop or boxing in the vicinity. (discretionary)
4. The immediate price action is smooth the price action isn't a complete mess. (discretionary)
5. gut feeling - with all the hours of screen time in my head this just looks 'right' (discretionary)

negative points

1. price narrowly failed to close below the previous low on my feed, normally I like to see price close below the previous days low.

trade management - this is where it gets very discretionary!

blue line - 1st trouble area
green line - 1st target
pink line - 2nd target

at this stage I have a pending order to open if price goes 20 points below the outside bar. order valid for 1 day, stop behind the bar. I like to see a quick move or I wait for a better opportunity. stop will be moved to break even at blue dotted line as I am looking for a runner down to the green line. Final target is the pink line. Taking profit is totally discretionary.

Given the quality of this set up I would be absolutely astounded if price did not make the blue dotted line if the order is filled and I would say there is a very good chance of price making the green dotted line. However price is likely to hit trouble around the blue line area and if price comes back I am unwilling to take a loss on a trade that has reached the 'first trouble area'.

read the chart and weep.
 

Attachments

  • auddkk.gif
    auddkk.gif
    17.6 KB · Views: 161
I hate to be the MajorDutch Grinch here..

We have 7 'setups' over 2 years.

The question "is this coincidence" could also be

"is this curve fitting?"
"is this statistically insignificant?"
"is this the result of someone looking for a pattern and finding one?"

The answer to all 3 is YES.

The last of my 3 questions is key. If you study cognitive bias you will understand that we often see what we want to see. We do positive testing and not negative testing.

At the end of the day, this sort of system is every retail traders wet dream. A mechanical 'solution' to trading that boils trading down to a series of steps that any idiot could follow.

There is nothing in the OPs post about WHY this would work. Yet, it is the WHY that is most important.

I would wager that MajorDutch didn't trade this system over the past 2 years. I would wager that this thread is the result of manually looking back 2 years or programmatic analysis. There is nothing wrong with that as long as you have a WHY to begin with. If you can't explain why a trading system would yield results, then the chances are you just curve fitted yourself something that works in hindsight.

Any method of trading must be based on some understanding of market dynamics. A valid trading method cannot be based on a simplistic pattern such as this that is used without context.

It just ain't that easy. Sure, we all want a set of simple rules we can follow to trade off in all market conditions. On the surface, that seems easier than learning to read the market. Fact is, learning to read the market is easier than trying to find a combination (out of trillions) of mechanical factors to trade off.

This is not a gift, it's a fncking curse.

Yours,

The Grinch

I agree with much of what toast says. I am the worlds expert on reading charts. There is justnobody in the world that I know of that is better than me in reading charts, if that is they are all yesterdays or perhaps last years. After all this is what the course selling vendors do.
I don't want ot upset dutch and even more so I don't want the fun police on my case, but what he has outlined is not a trading plan for the future.
:cool::cool::cool::cool::cool::cool::cool::cool::cool:
 
Then what is it? An explanation of a candle bar pattern/s, that may or may not work which in any case, should never be used unless you were going to use discretion to enter a position anyway?
 
It is a question of going back ---for me, a year is sufficient--- to see the maximum loss that would have happened to me if I had traded that system. If that loss is unacceptable it depends on how many times it would have occurred and, then, I cap it with a numerical amount. It is no good putting a stop at a level that would hurt and, then, because it happens a couple of times, throwing the baby out with the bathwater. So a logical stop should be limited by a numerical cap. If the stop, then, occurs too often to be a profitable proposition, then the system is not working and needs further fine tuning, or discarding.
 
right I didn't have to wait long for to give an example of what I am talking about. Here is a daily chart of AUDDKK the daily bar has just closed 11pm London on my feed. It's an outside bar at a big round number (6.0000) but that's not the point because it's not the bar that moves price. The point is this set up looks great in the context of overall price action. Why do I like this setup:

1. The bearish outside bar is at a swing high.
2. The bar is of good size compared to previous bars (this is discretionary)
3. The trade has plenty of 'space'. difficult to describe in words. there is no immediate chop or boxing in the vicinity. (discretionary)
4. The immediate price action is smooth the price action isn't a complete mess. (discretionary)
5. gut feeling - with all the hours of screen time in my head this just looks 'right' (discretionary)

I don't understand how you can say this is a swing high? Just because priced backed off a bit?

All I see is a massive upswing with alot of momentum.
 
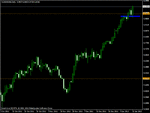
ah well the the anti TA crowd will love this. took a full bar loss on this tarde. will try and post some more live examples, first time in a long time I have taken a full bar loss, 5hit happens.:mad:

looking back the blue area marked on the chart was actually a small price pivot and I got punished for not spotting this, also the inability for price to close below the previous day's low was not a A+.
 

Attachments

  • auddkk3.gif
    auddkk3.gif
    13.7 KB · Views: 155
Last edited:
ah well the the anti TA crowd will love this. took a full bar loss on this tarde. will try and post some more live examples, first time in a long time I have taken a full bar loss, 5hit happens.:mad:

looking back the blue area marked on the chart was actually a small price pivot and I got punished for not spotting this, also the inability for price to close below the previous day's low was not a A+.

There is no "anti TA" crowd.

It's the "anti Idiot" crowd...
 
Sexpat bitter about something?

How original... :sleep:

What makes you think there is an "Anti TA Crew" on here.

There have actually been no "Anti TA" posts on here. There have been plenty of "Anti objective analysis", "Pro subjective analysis", "Anti search for a magical mechanical bullet" but not really Anti TA.

Keep up.
 
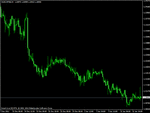
Nice H4 pin on EURCHF, I like this trade, order to open 1.20800 (47 point buffer below pin), stop behind pin. I will look to move my stop to b/e @ 1.20700 and manage the trade from there. order open for next 3 hours (until next 4 hour bar opens) otherwise cancelled, I like to see momentum on the 1st candle otherwise I am out.
 

Attachments

  • eurchf h4.gif
    eurchf h4.gif
    13.8 KB · Views: 123
Last edited:
Top