3rd generation NN, deep learning, deep belief nets and Restricted Boltzmann Machines

Incidentally, I have been trying to understand the hasline.m code. It seems to me that this is a count of the number of bars that cross a line defined by the mid of a bar. This is not the same as the article referenced in the code comments, where the idea is to find price lines with the minimum number of crossings. Furthermore, the result is counted over a period from 1 to t-1 which increases with t. So as t increases this count will increase, and the likelihood that it will exceed M will increase, until after a couple of hundred samples it seems that this indicator is very likely to be 1 and carry no information. Can someone check me on this please?

Yes, the code is wrong

Code:
its called from here in explosivePip

54  for t=1:length-1
          price = open;
          cond = zeros(1,NUM_COND);
          cond(1) = hasLine(low,high,t,'SUP'); 


function x = hasLine(low, high, t, type)
    % adopted from: http://articles.mql4.com/369
    % A Method for Drawing Support and Resistant Line
    % a suport line is present if there at least previous M bar that cross
    % its price.
    % We added that past high must not below current line for support
    % and past low must not above current line for resistant
    % In this simplified version, we choose:
    M = 4;   
    x = 0;
    if (t >= M)        
        cross_count = 0;
        mid = (low(t) + high(t))/2;
        last = t-1;     
        for i = 1:last  [B]<----- range will increase on every call[/B]
            if (low(t-i) < mid) && (high(t-i) > mid)
                cross_count = cross_count + 1; % first cross is itself
                if (cross_count >= M)
                    break;
                end

the range in 'for' statement will increase but it should be fixed. Perhaps instead of this we can use another solution. See this.

http://www.breakoutfutures.com/Newsletters/Newsletter0303.htm

Krzysztof
 
Here is a question for philosophers and thread poets. Care to answer?

There is inherent structure in the images and speech that have been the targets of most DBN research... most children can do better than most machines because they have learned the structure. The machines try to extract the structure. Some do it well for images and speech. Can they do it for markets?

Is there structure to some representation of the markets? Certainly not recognizable by most adults. Probably not recognizable by majority of traders. Do supertraders recognize structure, or are they just defying the odds?

DBN machines make sense for robotic applications. Do they make sense for the market?

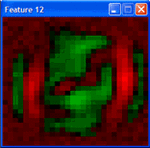
Here are features from patches of weights in the second layer of a DBN trained with contrastive divergence and fine tuned with conjugate gradients. These features are high level representations of price patterns. Very powerful stuff. The only concern and not the least would be to devise an online version of the training process so that we can use them in trading. I am not aware that online learning exists for deep structures.

Sorry got to close a position...
 

Attachments

  • Feature 5-50.gif
    Feature 5-50.gif
    13 KB · Views: 641
  • Feature 12-50.gif
    Feature 12-50.gif
    12.6 KB · Views: 550
  • Feature 10012.gif
    Feature 10012.gif
    12.6 KB · Views: 474
I found several bugs that were future leaks, and some that were due to stop and limit exit prices not correctly evaluated. I changed these to fix the bugs, and ran a strategy evaluation on the new code. The results are very different. e.g. For instantpip I get profit = -$1724 on 461 trades. (n)

I did not test the other strategies, since I do not have confidence in my ability to code fixes in MatLab.:eek: The modified code is contained in the zip file below. You will find that there are changes in spotFX.m,hasline.m, indicatorBuilder.m, and the four exits. All of my future leak changes are marked by a comment beginning with scf, so they are easily found; however, to fix the problem with stop and limit exit prices I had to make larger changes, so not all those are commented. But they are obvious on comparison to earlier versions.

The code I used to train and evaluate the instantpip strategy is in the zip file. Anyone interested please do not take my word, but look at the code and find any errors that I have made. I hope you find some.

If you find no errors, then I suggest that most of the good results reported in TradeFX are due to future leaks and incorrect exit price evaluation. We must do the work over!:cry:
 

Attachments

  • TradeFX mods.zip
    10.7 KB · Views: 466
Here are features from patches of weights in the second layer of a DBN trained with contrastive divergence and fine tuned with conjugate gradients. These features are high level representations of price patterns. Very powerful stuff. The only concern and not the least would be to devise an online version of the training process so that we can use them in trading. I am not aware that online learning exists for deep structures.

Sorry got to close a position...

So are you using this autoencoder setup with pretraining and fine tuning ?

Did you or somebody else try Convolutional Neural Networks for market data ??

Krzysztof
 
Here are features from patches of weights in the second layer of a DBN trained with contrastive divergence and fine tuned with conjugate gradients. These features are high level representations of price patterns. Very powerful stuff. The only concern and not the least would be to devise an online version of the training process so that we can use them in trading. I am not aware that online learning exists for deep structures.

Sorry got to close a position...

I don't see why an online version could not be done. Conceptually you could do it with two Dll's, one to train and one to classify as follows:
Arrays/structures:
Rates array.. contains OHLCV for each bar
Target array..contains results if entry on a given bar
Input array
Net
MT4
Allocates memory for all structures (This is so that strategy tester will work. )
Maintains rates and Target array
Calls Net_Train with pointers to arrays
Calls Net_Classify with pointers to arrays
Uses result to trade
Net_Train
Calls feature_builder to build input array
Uses target array to label input array
Trains Net
Net_Classify
Calls feature_builder to update input array
Applies net to determine prediction
Feature_Builder
Calculates input to net .. indicators, conditions to build input array

Operation:
MT4 initializes the net by calling Net_Train
At end of each bar:
If a new label has been determined, MT4 calls Net_Train to update input array and retrain the net.
MT4 calls Net_Classify to get a prediction
MT4 makes appropriate trading decisions.

This all assumes that a net_train dll could run in 1 bar time. If not, then the training would have to go on in the background while new input was collected. Would require some double buffering.

Those are intriguing pictures of hidden structure.:clap: What is the nature of the input price patterns, and the DBN used to find them? I assume unsupervised learning for this level?
 
I found several bugs that were future leaks, and some that were due to stop and limit exit prices not correctly evaluated. I changed these to fix the bugs, and ran a strategy evaluation on the new code. The results are very different. e.g. For instantpip I get profit = -$1724 on 461 trades. (n)

I did not test the other strategies, since I do not have confidence in my ability to code fixes in MatLab.:eek: The modified code is contained in the zip file below. You will find that there are changes in spotFX.m,hasline.m, indicatorBuilder.m, and the four exits. All of my future leak changes are marked by a comment beginning with scf, so they are easily found; however, to fix the problem with stop and limit exit prices I had to make larger changes, so not all those are commented. But they are obvious on comparison to earlier versions.

The code I used to train and evaluate the instantpip strategy is in the zip file. Anyone interested please do not take my word, but look at the code and find any errors that I have made. I hope you find some.

If you find no errors, then I suggest that most of the good results reported in TradeFX are due to future leaks and incorrect exit price evaluation. We must do the work over!:cry:

After three small changes in the scripts (twice change open to close and transaction_fee set) accuracy seems to be 68.1% for instantPip strategy for EURUSD30_1_16Apr09.csv.

Missing funcionality in all those scripts seems to be spread handling. Spread must be considered both in profit calculation and entry/exit conditions calculation.

Krzysztof
 
So are you using this autoencoder setup with pretraining and fine tuning ?

Did you or somebody else try Convolutional Neural Networks for market data ??

Krzysztof

Contrastive divergence as pretraining and conjugate gradients as fine tuning.

I also looked into convolutional nets with not much luck either. They seem to lend themselves to online updates better though. Here is some source code made public if you want to look into:
http://www.codeproject.com/KB/library/NeuralNetRecognition.aspx
http://www.inf.ufsc.br/~otuyama/eng/academic/cnn/index.html
 
I don't see why an online version could not be done. Conceptually you could do it with two Dll's, one to train and one to classify as follows:
Arrays/structures:
Rates array.. contains OHLCV for each bar
Target array..contains results if entry on a given bar
Input array
Net
MT4
Allocates memory for all structures (This is so that strategy tester will work. )
Maintains rates and Target array
Calls Net_Train with pointers to arrays
Calls Net_Classify with pointers to arrays
Uses result to trade
Net_Train
Calls feature_builder to build input array
Uses target array to label input array
Trains Net
Net_Classify
Calls feature_builder to update input array
Applies net to determine prediction
Feature_Builder
Calculates input to net .. indicators, conditions to build input array

Operation:
MT4 initializes the net by calling Net_Train
At end of each bar:
If a new label has been determined, MT4 calls Net_Train to update input array and retrain the net.
MT4 calls Net_Classify to get a prediction
MT4 makes appropriate trading decisions.

This all assumes that a net_train dll could run in 1 bar time. If not, then the training would have to go on in the background while new input was collected. Would require some double buffering.

Those are intriguing pictures of hidden structure.:clap: What is the nature of the input price patterns, and the DBN used to find them? I assume unsupervised learning for this level?

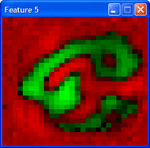
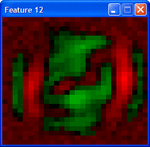
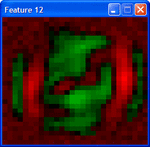
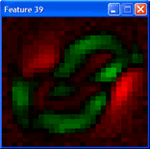
I fed the net with 2D image representations of the patterns. For the example below I used cycles that fit price well in the first part of the pattern but degrade in the second part. Next I attached a label to each of these patterns by looking for cycles that fit well the second part. These classes of patterns capture a switch of the cycle. To make the network happy I had to generate tons of surrogates from these patterns making sure there were no ambiguities between the classes. Below, I show 2 features from the net. See how the feature on the right has rotated clockwise. They indicate that price has switched to a larger time-frame. Now the remaining problem is not an implementation issue but I did not figure out yet how to make an online version for the training phase that would provide nicely evolving features.
 

Attachments

  • Feature 12-50.gif
    Feature 12-50.gif
    9.1 KB · Views: 4,063
  • Feature 39-50.gif
    Feature 39-50.gif
    8.7 KB · Views: 4,090
I fed the net with 2D image representations of the patterns. For the example below I used cycles that fit price well in the first part of the pattern but degrade in the second part. Next I attached a label to each of these patterns by looking for cycles that fit well the second part. These classes of patterns capture a switch of the cycle. To make the network happy I had to generate tons of surrogates from these patterns making sure there were no ambiguities between the classes. Below, I show 2 features from the net. See how the feature on the right has rotated clockwise. They indicate that price has switched to a larger time-frame. Now the remaining problem is not an implementation issue but I did not figure out yet how to make an online version for the training phase that would provide nicely evolving features.

How much of the process required manual intervention?

What do you mean by cycles? There are so many discussions of cycles derived from FFT's, Goertzel, etc. but I think you mean something else.

How do you know when a network is happy? If you can distill that info, I'll buy a can or two. I still don't know when my wife is happy, and I've been married for many years.:LOL:
 
Some TradeFX results

Here is some TradeFX results obtained using attached EURUSD 1m file for instantPip strategy. I was changing the value of cutpoint variable between 2500 - 400.

For explanation: cutpoint 400 means 400 OOS bars and 400 training bars, cutpoint 1000 means 1000 OOS bars and 1000 training bars

cutpoint accuracy, total profit, number of trades

2500 62.7 0 0

2000 64.2 -0.8 54

1500 62.86 -82.7 276

1000 58.5 12.9 244

400 64 50.8 92

so intial conclusion is that for using SVM in predicting trade strategy results accuracy is quite high 58-64 %. It also shows that the prediction time horizon is quite short. As this strategy makes sell orders only more tests like this on different data sets must be done to avoid 'lucky' results.

Krzysztof
 

Attachments

  • EURUSD1.csv
    510.8 KB · Views: 462
Last edited:
How much of the process required manual intervention?

What do you mean by cycles? There are so many discussions of cycles derived from FFT's, Goertzel, etc. but I think you mean something else.

How do you know when a network is happy? If you can distill that info, I'll buy a can or two. I still don't know when my wife is happy, and I've been married for many years.:LOL:

The cycle part is now automated. I use it in my trading. The cycles are from a third party package for Neuroshell. It's better than FFT in that it is data aware. Bandpass filters are computed from volatility itself.

Well, it will be wine for me. I am getting intimate with my nets. I figure they are happy when they make me happy. For sure DBNs need a lot of training samples before the features exhibit some structure. They settle very slowly...........
 
Re: Some TradeFX results

Here is some TradeFX results obtained using attached EURUSD 1m file for instantPip strategy. I was changing the value of cutpoint variable between 2500 - 400.

For explanation: cutpoint 400 means 400 OOS bars and 400 training bars, cutpoint 1000 means 1000 OOS bars and 1000 training bars

cutpoint accuracy, total profit, number of trades

2500 62.7 0 0

2000 64.2 -0.8 54

1500 62.86 -82.7 276

1000 58.5 12.9 244

400 64 50.8 92

so intial conclusion is that for using SVM in predicting trade strategy results accuracy is quite high 58-64 %. It also shows that the prediction time horizon is quite short. As this strategy makes sell orders only more tests like this on different data sets must be done to avoid 'lucky' results.

Krzysztof

Interesting post! It would be interesting to see how your system behaves on ranging markets... My experience with SVMs is that they give similar results than NN-based classifiers. SVMs are good though because they are less prone to overfitting. That might partly explain your results.
 
NNs of any kind are elaborate schemes for curve-fitting and nothing more than that.

Let me quote StratOpt

There is absolutely nothing wrong with curve fitting. The only danger in optimizing is if you allow an overfit. Optimizing is only one part of a testing equation. In all reality, If you develop a strategy of any kind and it has a parameter or any other rule in which you make a choice as to what setting or rule to use then you have already curve fit before you begin any optimization. So yes you are curve fitting and yes genetic optimizers are a "fancy" way of doing such, and yes that is what they are designed to do. Again, there is nothing wrong with any of that. I have been very successfully incorporating such things into my development and testing and trading for quite a long while now and can't imagine not using them and remaining successful with any sort of programmatic strategy trading.

http://www.trade2win.com/boards/tradestation/101792-ts-add-ons-strategy-development.html#post1229142
 
I fed the net with 2D image representations of the patterns. For the example below I used cycles that fit price well in the first part of the pattern but degrade in the second part. Next I attached a label to each of these patterns by looking for cycles that fit well the second part. These classes of patterns capture a switch of the cycle. To make the network happy I had to generate tons of surrogates from these patterns making sure there were no ambiguities between the classes. Below, I show 2 features from the net. See how the feature on the right has rotated clockwise. They indicate that price has switched to a larger time-frame. Now the remaining problem is not an implementation issue but I did not figure out yet how to make an online version for the training phase that would provide nicely evolving features.

So actually how do you model the time series ?? Using RBM ?? I think RBM was designed
for static picture recognition not dynamic time series. Or maybe you just feeding nets with static picture of the pattern ??? But in this case all info about dynamics of time series is lost.

Do you measure any error of recognition ?

Krzysztof
 
Here is a question for philosophers and thread poets. Care to answer?

There is inherent structure in the images and speech that have been the targets of most DBN research... most children can do better than most machines because they have learned the structure. The machines try to extract the structure. Some do it well for images and speech. Can they do it for markets?

Is there structure to some representation of the markets? Certainly not recognizable by most adults. Probably not recognizable by majority of traders. Do supertraders recognize structure, or are they just defying the odds?

DBN machines make sense for robotic applications. Do they make sense for the market?

No.

Let's say you have a bad knee. You can see a number of different types of specialist and depending on the area of specialisation, you will either have a muscle problem, bone problem or even immune system problem. Therapy will be physio, drugs or operation.

What you won't get much of is "this is not within my area of specialisation". After all, if the only tool you have is a hammer...

And so it comes to trading. Take someone with a background in statistics and they will probably use statistical models. Take someone with a background in programming and they will be writing strategies based on existing specifications (i.e. trading books). Take someone with a background in Neural Nets.....

So - this is more of the same. Attempting to use knowledge gained outside of trading within trading. Trying to apply your own comfort zone where you are not comfortable.

Ultimately - if you want to make money trading, you have to learn how to trade yourself. If you can't do that, you have zero chance of getting a computer to learn for you.
 
Top