3rd generation NN, deep learning, deep belief nets and Restricted Boltzmann Machines

summary

Hello,

As I have a lot of requests what actually was done in this thread would like to summarize this thread i.e. what was done during this almost 6 years by me.

- Initial TradeFX system was extended and redesigned. The BUY orders were added, bugs and future leaks removed and proper out of sample testing implemented. Than additionl scripts were designed to combine separate BUY and SELL signals as an ensemble trading signal. The evaluation of the system was done using portfolio of 8 symbols i.e. 1min data EURUSD, GBPUSD, AUDUSD, XAUUSD, GBPJPY, AUDJPY and SP500 on daily basis, than all daily results from all symbols were combined in one result. Measures used for evaluation was a mix of Machine Learning standard measures (Precision, Accuracy, Recall) and strategy performance measures like, Profit, Profit Factor, Number of pairs symbol/algo profitable or per trade profit.

- On the MT4 side, the EA was redesigned and adapted to handle multiple symbols so in total 8 EAs were running in pararell, each of them trading different symbol and communicating with different MATLAB engine.

- In total around 21 different ML algorithms were integrated and tried to find out the best performing ones for HF financial data. Algorithms were integrated from Theano, Weka and different MATLAB toolboxes. Algorithms tried were:

LIBSVM, LIBLINEAR DBN, RBM, TDBN, PegasosLR, PegasosSVM, Ridor, Ripper, J48, Tlogistic_cg, Tlogistgic_sgd, Slogistic, SDAE, LMT, CHIRP, LDKL, ELM, SVMPerf, ISSVM, DCSVM.

- Different preprocessing methods were tried like rebinning of data, filtering of data by Ehlers filters, different feature selection and scaling methods.

- Different strategies which were creating different input data and labels were also created and tested.

- Different retraining periods (every 24, 12, 8 and 4h) and different lengths of training data was also checked.

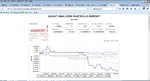
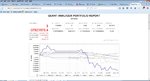
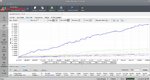
- Differen Portfolios were created using QuantAnalyzer which dramatically was improving performance however it was not possible to test it in 'Walk Forward' way due to limits in QuantAnalyzer design.

As a conclusion I can say that thats financial data seems to be very strong non stationary which cause very high variance of output and non stable performance, for some weeks this system was very profitable for some not (with portfolio equal weighted).

For sure it is possible to make portfolio optimization (Markowitz way) which would improve the performance however i didn't have a platform to properly test it, maybe when I will find time I will integrate portfolio optimization MATLAB solution with the system and measure possible improvement of performance.

Krzysztof
 
finally after 5 years since I started with it somebody else did something and publish some info...

https://www.mql5.com/en/articles/1103

Now perhaps more people can get interested !!!

Krzysztof

Which I did. I actually test the method described for 1 week. The 4 first days were great, but unfortunately, friday came out the opposite way.

So, from your experience, it seems that you retrain your system a lot. Do you confirm that on a M1 system I should retrain my neurons network everyday once the market is closed ? The market looks like evolving its behavior to me.

Its not closed. FOREX is open 24/5, futures has 1h break at i think. I was initially retraining ever 24h and tried in backtest every 12,8 and 4h.

Once week of trading is nothing, you should run it for 1 month at least for a few instruments to make some conclusions, otherwise variance of output will just mess you. Did you manage to get backtester working
for this solution ??

Krzysztof
 
Did you manage to get backtester working for this solution ??

From MT4, unfortunately not. I'll try something directly in R, but that might need some calculation time. And experience always taught that live is quite different from backtesting. Like you say, 1 month of tests will certainly give me a better view.

By the way, I test on DAX 30 M1, not on FOREX, which explains why my market gets closed. The main reason is the very little spread I get from my broker on this market. My tests give like 60 trades a day.

On monday I'll compare (still on DAX 30) :

- My previous model again ;
- An updated model, still on M1 ;
- Another model on M5.

I can use micro contracts with no commission, so I can do live tests with no big risks.

Personally i think that reliable back tester outside MT4 (so like in R in your case) is a key here. In such case you can try some combinations to see if something works or not, than you can use parallel processing to speed up.

For example to back test 1 day on 1 instrument i use strategy which generates data separate for buy and sell like 20000x250 data points and this x2 (cause Buy and Sell) so daily trading model is build based on 10 mln data points. Than after a few weeks of such back test for a few instruments I can see some consistency in results change otherwise is just flips up and down. To try on one instrument is very risky in my opinion. One day/week/month can be OK, other down so its very easy to get fooled....

Krzysztof
 
extensive backtest

I'm back !!! Recently I found some time and decided to make some backtest
to find out which feature selection method is better and which type of inputs are more suitable for AI algos. Thanks to my new 32 core cluster it was possible in reasonable time.

test was looking like follows:

1) 7 weeks of 1 min data for 8 symbols: 1st 2 weeks of March, April and 1st week of May.

2) two strategies producing inputs: one producing lags 1:1440 with step of 10 so 144 lags and another creating inputs based on TA indicators - SMAs, RSIs, BBs, ATRs Highest/Lowest etc in total 250 inputs.

3) to both strategies automatic feature selection method is applied MRMR and FCBF that bootstraped 100 times to select dominating features. All this is done separately for BUYs and SELLs

4) On the base of this 5 different algos is trained and evaluated.

and here are the results:


Code:
>> s7
Enter result file name: str7_dl1_tsi900
Enter number of FE algos in result file (2 or 5 or 7 or 11):2
Enter the range of recent weeks to summarize:1:7
   NORMAL DATA AVERAGE RESULTS mrmr 10 bootstrap 100 TOTAL PEGASOS CHIRP J48 RBM SDAE ELM
      Profit           PF         avMC         avPP         avRC        totTP        totFP         PF>1     algosnum     perTrade
 -6010470.14         0.27        -0.11        51.09         0.40      71790.0      68380.6         18.6         48.0        -40.6

 -1386058.21         0.03        -0.16        49.32         0.44      13258.6      14310.4          3.1          8.0        -36.6

   149348.54         1.17        -0.03        53.54         0.37      11025.4       9482.3          3.4          8.0          7.3

 -1550205.96         0.27        -0.16        49.57         0.35      10979.6      11196.1          3.1          8.0        -74.9

 -1745195.04         0.14        -0.05        51.44         0.52      14624.9      13304.6          2.9          8.0        -58.5

 -1003382.76         0.23        -0.18        49.50         0.30       9813.4       9941.7          3.1          8.0        -52.3

  -474976.71         0.68        -0.08        53.14         0.39      12088.1      10145.4          2.9          8.0        -20.7

   NORMAL DATA AVERAGE RESULTS fcbf boostrap 100 TOTAL PEGASOS CHIRP J48 RBM SDAE ELM
      Profit           PF         avMC         avPP         avRC        totTP        totFP         PF>1     algosnum     perTrade
 -9112054.46         0.01        -0.22        46.49         0.27      49853.4      57723.3         17.4         48.0        -82.2

 -1505624.04         0.02        -0.25        45.33         0.22       7217.9       8778.6          3.3          8.0        -93.7

 -1937587.66         0.01        -0.20        46.53         0.22       6901.3       8563.7          3.1          8.0       -134.1

  -628267.07         0.27        -0.17        48.45         0.27       8299.9       9136.4          2.9          8.0        -33.0

 -2380900.80         0.14        -0.20        45.55         0.31       9254.1      10522.0          2.3          8.0       -108.2

  -360237.09         0.76        -0.28        44.59         0.28       9069.3      10470.7          3.3          8.0        -35.7

 -2299437.80         0.16        -0.19        48.55         0.30       9111.0      10251.9          2.6          8.0       -117.4

>> s7
Enter result file name: str9_dl1_tsi900
Enter number of FE algos in result file (2 or 5 or 7 or 11):2
Enter the range of recent weeks to summarize:1:7
   NORMAL DATA AVERAGE RESULTS mrmr 10 bootstrap 100 TOTAL PEGASOS CHIRP J48 RBM SDAE ELM
      Profit           PF         avMC         avPP         avRC        totTP        totFP         PF>1     algosnum     perTrade
 -7915126.97         0.05        -0.15        49.80         0.34      63655.6      62630.6         18.6         48.0        -64.5

 -1152862.77         0.10        -0.18        48.66         0.35      10658.0      10909.1          2.9          8.0        -47.1

 -1368002.57         0.25        -0.10        49.53         0.36      10574.9      10395.7          2.6          8.0        -67.8

 -2068737.56         0.08        -0.24        46.94         0.33      10498.4      11885.4          3.3          8.0        -95.4

  -486754.03         0.36        -0.12        54.30         0.38      11692.6       9590.7          3.4          8.0        -29.1

 -1254911.83         0.34        -0.16        50.08         0.31      10089.6       9426.3          3.0          8.0        -68.6

 -1583858.21         0.06        -0.09        49.33         0.35      10142.1      10423.3          3.4          8.0        -80.7

   NORMAL DATA AVERAGE RESULTS fcbf boostrap 100 TOTAL PEGASOS CHIRP J48 RBM SDAE ELM
      Profit           PF         avMC         avPP         avRC        totTP        totFP         PF>1     algosnum     perTrade
-13535027.66         0.16        -0.15        48.92         0.32      57250.9      58903.1         16.3         48.0       -120.4

 -1409186.23         0.10        -0.19        48.93         0.23       7308.4       7733.6          3.3          8.0       -101.1

 -2072401.99         0.16        -0.12        50.20         0.28       8145.3       8596.3          2.6          8.0       -121.4

 -2846206.40         0.17        -0.23        45.18         0.30       9162.9      11338.3          2.3          8.0       -142.0

 -1584061.57         0.03        -0.12        51.52         0.43      13032.0      11452.9          2.9          8.0        -68.3

 -3572609.14         0.09        -0.12        47.52         0.32       9000.9       9844.4          2.4          8.0       -207.5

 -2050562.33         0.17        -0.10        50.35         0.36      10601.4       9937.7          2.9          8.0       -100.2

>>

measures used were :

Profit - profit
PF - profit factor
avMC - average Mathew corr index
avPP - average % profitable
avRC - average recall
totTP - successful trades
totFP - missed trades
PF>1 - algos with PF>1
algosnum - number of algos
perTrade - profit per trade

from all those results strategy 7 ( with lags) seems to be slightly better than strategy with indicators. As per feature selection method MRMR seems to be slightly better than FCBF. Only CHIRP algorithm with MRMR method managed to be profitable.

Krzysztof
 
per symbol

as per symbol it was looking like this

Code:
>> symbols
Enter result file name: str9_dl1_tsi900_symb
Enter number of FE algos in result file (2):2
Enter the range of recent weeks to summarize:1:7
   NORMAL DATA AVERAGE RESULTS mrmr 10 bootstrap 100 AUDUSD EURUSD GBPUSD XAUUSD AUDJPY GBPJPY USDJPY US500
      Profit           PF         avMC         avPP         avRC        totTP        totFP         PF>1     algosnum     perTrade
   801732.71        23.62        -0.18        55.35         0.45      11423.9       9238.1          3.6          6.0         38.7

  -327093.43         0.62        -0.10        51.07         0.42       9212.3       8900.9          2.7          6.0        -27.5

 -1245285.71         0.00        -0.11        50.45         0.33       7154.0       7420.4          2.6          6.0        -92.3

 -1822539.69         0.15        -0.15        53.24         0.36       8761.1       8334.1          1.6          6.0        -83.5

  -522528.86         0.43        -0.16        48.68         0.25       5858.0       6194.0          2.3          6.0        -52.5

 -5005324.57         0.15        -0.19        43.86         0.32       7023.3       8433.7          0.9          6.0       -312.4

   603032.57         2.78        -0.17        48.68         0.28       6564.9       6740.1          2.7          6.0         58.2

  -397120.00         0.46        -0.12        47.20         0.36       7658.1       7369.1          2.3          6.0        -43.7

   NORMAL DATA AVERAGE RESULTS fcbf boostrap 100 AUDUSD EURUSD GBPUSD XAUUSD AUDJPY GBPJPY USDJPY US500
      Profit           PF         avMC         avPP         avRC        totTP        totFP         PF>1     algosnum     perTrade
   648810.71         3.41        -0.12        56.06         0.41       9875.9       8089.3          3.4          6.0         47.3

   271720.71         1.69        -0.01        56.65         0.48      10585.9       8149.6          2.4          6.0          9.4

 -1741227.14         0.13        -0.12        48.04         0.25       5274.7       6085.6          1.9          6.0       -167.7

 -2154404.94         0.17        -0.21        49.24         0.35       8089.1       8789.0          2.1          6.0       -100.5

 -1855797.43         0.15        -0.20        42.97         0.24       5349.1       7016.0          1.7          6.0       -145.8

 -6576690.71         0.21        -0.13        47.89         0.34       7011.1       8369.7          0.4          6.0       -416.5

  -932515.29         0.11        -0.14        48.73         0.21       4891.1       5125.9          2.6          6.0        -70.7

 -1194923.57         0.05        -0.25        41.56         0.28       6173.9       7278.1          1.7          6.0       -126.9

>> symbols
Enter result file name: str7_dl1_tsi900_symb
Enter number of FE algos in result file (2):2
Enter the range of recent weeks to summarize:1:7
   NORMAL DATA AVERAGE RESULTS mrmr 10 bootstrap 100 AUDUSD EURUSD GBPUSD XAUUSD AUDJPY GBPJPY USDJPY US500
      Profit           PF         avMC         avPP         avRC        totTP        totFP         PF>1     algosnum     perTrade
   222832.43         1.59        -0.22        51.55         0.42      10133.1      10140.9          2.7          6.0         25.1

 -1304787.00         0.03        -0.11        48.46         0.40       8690.1       9081.4          1.6          6.0        -82.3

  -726481.00         0.23        -0.15        49.30         0.36       8122.6       8374.0          2.3          6.0        -44.8

 -1953006.86         0.18        -0.06        53.80         0.41       9720.6       8138.3          2.1          6.0       -122.5

   541400.86         1.89        -0.09        52.83         0.37       8539.6       7413.3          3.0          6.0         48.3

 -1406775.00         0.20        -0.05        57.57         0.44      10354.3       7486.4          1.7          6.0        -82.0

    61508.57         1.10        -0.13        48.46         0.35       7578.1       7774.3          2.7          6.0         -4.4

 -1445162.14         0.13        -0.09        46.71         0.44       8651.6       9972.0          2.4          6.0        -70.7

   NORMAL DATA AVERAGE RESULTS fcbf boostrap 100 AUDUSD EURUSD GBPUSD XAUUSD AUDJPY GBPJPY USDJPY US500
      Profit           PF         avMC         avPP         avRC        totTP        totFP         PF>1     algosnum     perTrade
  -531039.14         0.11        -0.32        45.28         0.26       6535.6       8206.3          2.1          6.0        -32.0

 -1989144.14         0.02        -0.14        46.12         0.39       8455.6       9496.6          1.9          6.0       -116.3

 -1691446.29         0.08        -0.27        41.44         0.23       5277.6       7395.6          1.6          6.0       -111.4

 -1208596.89         0.40        -0.17        54.25         0.29       7251.6       7321.4          2.9          6.0        -64.1

  -708924.14         0.48        -0.16        45.30         0.23       5391.4       6356.7          2.7          6.0        -18.8

 -1179072.86         0.18        -0.21        50.84         0.23       6013.1       5134.3          2.1          6.0       -142.0

    71007.57         1.07        -0.24        44.40         0.24       5669.0       6514.4          2.6          6.0         -2.6

 -1874838.57         0.08        -0.22        43.44         0.26       5259.6       7298.0          1.6          6.0       -145.7

>>


So the best instrument to trade was AUDUSD and the worst GBPJPY.

Krzysztof
 
training size

Recently I developed the MATLAB script which writes trades generated by my back tester in format recognizable by Quant analyzer. Thanks to this I can analyze and visualize very big trades files.

My always not complete answered question was how big size should be a training set. So I made a 3 back tests in my usual setup i.e 7 weeks of 1min data x 8 instruments x 5 algorithms to detect differences in performance for training sets 10k, 20k and 30k training examples. Each of this back test generate more than million trades so I believe result is quite significant.

So here are the results for 10k, 20k and 30k training sets
 

Attachments

  • 10k.jpg
    10k.jpg
    205 KB · Views: 217
  • 20k.jpg
    20k.jpg
    210.8 KB · Views: 239
  • 30k.jpg
    30k.jpg
    214.6 KB · Views: 181
From this you can see that the most optimal seems to be 20k training set (PF=0.86). The differences in performance are quite small however I believe any small change is significant here due to big amount of trades.

Krzysztof
 
more statistics

Here is some more statistics per algo and per instrument. Interestingly ELM (Extreme Learnig Machine) algo seems to be a leader here and it is not some advance version like with neuron pruning or something.


Code:
>> resultsAll('')
resultsAll('*Peg*')
resultsAll('*CHIRP*')
resultsAll('*J48*')
resultsAll('*RBM*')
resultsAll('*SDAE*')
resultsAll('*ELM*')
   NORMAL DATA AVERAGE RESULTS
      Profit           PF         avMC         avPP         avRC        totTP        totFP         PF>1     algosnum     perTrade
-37619021.40         0.86        -0.08        52.74         0.38       482281       438392          143          336       -40.86

   NORMAL DATA AVERAGE RESULTS
      Profit           PF         avMC         avPP         avRC        totTP        totFP         PF>1     algosnum     perTrade
 -9610984.00         0.80        -0.11        50.52         0.44        88309        92416           22           56       -53.18

   NORMAL DATA AVERAGE RESULTS
      Profit           PF         avMC         avPP         avRC        totTP        totFP         PF>1     algosnum     perTrade
 -1648400.90         0.96         0.01        53.33         0.37        74124        63821           26           56       -11.95

   NORMAL DATA AVERAGE RESULTS
      Profit           PF         avMC         avPP         avRC        totTP        totFP         PF>1     algosnum     perTrade
 -3352872.60         0.92        -0.10        53.40         0.36        77407        68734           25           56       -22.94

   NORMAL DATA AVERAGE RESULTS
      Profit           PF         avMC         avPP         avRC        totTP        totFP         PF>1     algosnum     perTrade
-11844030.70         0.77        -0.09        53.80         0.39        82260        71854           23           56       -76.85

   NORMAL DATA AVERAGE RESULTS
      Profit           PF         avMC         avPP         avRC        totTP        totFP         PF>1     algosnum     perTrade
-10464127.80         0.78        -0.10        52.09         0.36        79059        71029           20           56       -69.72

   NORMAL DATA AVERAGE RESULTS
      Profit           PF         avMC         avPP         avRC        totTP        totFP         PF>1     algosnum     perTrade
  -698605.40         0.98        -0.06        53.27         0.38        81122        70538           27           56        -4.61

>> resultsAll('*AUDUSD*')
resultsAll('*EURUSD*')
resultsAll('*GBPUSD*')
resultsAll('*XAUUSD*')
resultsAll('*AUDJPY*')
resultsAll('*GBPJPY*')
resultsAll('*USDJPY*')
resultsAll('*US500*')
   NORMAL DATA AVERAGE RESULTS
      Profit           PF         avMC         avPP         avRC        totTP        totFP         PF>1     algosnum     perTrade
  5183686.00         1.31        -0.21        53.06         0.46        78651        72934           22           42        34.20

   NORMAL DATA AVERAGE RESULTS
      Profit           PF         avMC         avPP         avRC        totTP        totFP         PF>1     algosnum     perTrade
 -9554352.00         0.64        -0.06        50.58         0.41        60699        60050           15           42       -79.13

   NORMAL DATA AVERAGE RESULTS
      Profit           PF         avMC         avPP         avRC        totTP        totFP         PF>1     algosnum     perTrade
 -4125243.00         0.86        -0.04        54.22         0.38        58468        51984           21           42       -37.35

   NORMAL DATA AVERAGE RESULTS
      Profit           PF         avMC         avPP         avRC        totTP        totFP         PF>1     algosnum     perTrade
-10623475.40         0.78        -0.08        56.60         0.36        62204        51467           12           42       -93.46

   NORMAL DATA AVERAGE RESULTS
      Profit           PF         avMC         avPP         avRC        totTP        totFP         PF>1     algosnum     perTrade
 -1944166.00         0.93        -0.06        52.24         0.35        53886        50569           18           42       -18.61

   NORMAL DATA AVERAGE RESULTS
      Profit           PF         avMC         avPP         avRC        totTP        totFP         PF>1     algosnum     perTrade
-18078067.00         0.70        -0.03        54.88         0.41        62247        50187           16           42      -160.79

   NORMAL DATA AVERAGE RESULTS
      Profit           PF         avMC         avPP         avRC        totTP        totFP         PF>1     algosnum     perTrade
  4059776.00         1.16        -0.10        48.97         0.33        51240        50981           19           42        39.72

   NORMAL DATA AVERAGE RESULTS
      Profit           PF         avMC         avPP         avRC        totTP        totFP         PF>1     algosnum     perTrade
 -2537180.00         0.90        -0.04        51.33         0.36        54886        50220           20           42       -24.14
 
more statistics

Clearly some pairs instrument/algo are are quite profitable and some not

Code:
>> resultsAll('*AUDUSD*ELM*')
   NORMAL DATA AVERAGE RESULTS
      Profit           PF         avMC         avPP         avRC        totTP        totFP         PF>1     algosnum     perTrade
   836216.00         1.30        -0.21        53.36         0.52        14426        13977            3            7        29.44

>> resultsAll('*USDJPY*ELM*')
   NORMAL DATA AVERAGE RESULTS
      Profit           PF         avMC         avPP         avRC        totTP        totFP         PF>1     algosnum     perTrade
  2442035.00         1.66        -0.12        44.75         0.30         7868         8413            4            7       149.99

>> resultsAll('*USDJPY*CHIRP*')
   NORMAL DATA AVERAGE RESULTS
      Profit           PF         avMC         avPP         avRC        totTP        totFP         PF>1     algosnum     perTrade
  2533362.00         1.85        -0.03        48.41         0.28         6896         6901            3            7       183.62

>> resultsAll('*AUDUSD*CHIRP*')
   NORMAL DATA AVERAGE RESULTS
      Profit           PF         avMC         avPP         avRC        totTP        totFP         PF>1     algosnum     perTrade
   887668.00         1.33        -0.07        52.70         0.49        12455        11286            4            7        37.39

>> resultsAll('*EURUSD*CHIRP*')
   NORMAL DATA AVERAGE RESULTS
      Profit           PF         avMC         avPP         avRC        totTP        totFP         PF>1     algosnum     perTrade
 -2448545.00         0.47        -0.08        44.06         0.35         8230         9996            2            7      -134.34

>> resultsAll('*EURUSD*ELM*')
   NORMAL DATA AVERAGE RESULTS
      Profit           PF         avMC         avPP         avRC        totTP        totFP         PF>1     algosnum     perTrade
 -1598321.00         0.62        -0.03        52.55         0.36         9034         8434            3            7       -91.50

>>
 
backtest 8 months

Here are the results of 8 months backtest of portfolio of 8 symbols. In summary 946k trades was done, PF=1.6, PP=56.2% wins. Backtest was done with 0.01 lot size, trading ever 2 min.

Krzysztof
 

Attachments

  • ELM.jpg
    ELM.jpg
    281 KB · Views: 240
Hi Krzysztof,

Sound really good !! The forward test still okay ? you are happy with strategyquant?

Can you tell me more about this systems?

Regards.
 
strategy quant and quant analyzer

Hi Krzysztof,

Sound really good !! The forward test still okay ? you are happy with strategyquant?

Can you tell me more about this systems?

Regards.

Hi,

I don't use strategyquant but quantanalyzer for trade analysis. Strategyquant (so strategy creator) is very buggy, new revision is promised since more than a year but still not done....all of this strategy makers suffer from multiple test bias. See this

http://www.strategyquant.com/forum/topic/3621-multiple-testing/?hl=krzysiaczek99#entry12314

And believe the owner of this product just deletes unwanted post on forum, I just tried and can not find some of my posts related to bugs and quality of backtest...

Krzysztof
 
Not yet but i'm close to it. Key is a back test here as for live/demo trading you need to wait for a months for results and even this its not enough as you don't have a complete picture whats going on.

For back test you need except smart fast coding kind of supercomputer infrastructure to generated
those millions of trades for different algos and symbols otherwise variance and randomness will just fool you. Recently i manage to extend my cluster to 80 cores so can get reasonable results pretty fast.

Krzysztof
 
I look forward to seeing your results when you finally feel it is time to go real money time.
Perhaps you will sell the programmes made with your hard labour ?
I got my ideas coded up in MT4 and am testing it now on a demo account. Looks about break even.
 
Krzysztof,

Since part of ELM algorithm is random ( setting of the input weights and hidden layer bias ), output results of same activation function and same number of hidden neurons may change...

Know you fix this part of ELM ?

Regards.
 
In testing, the algo should be profitable on any pair but not necessarily on any time frame. Thus if it has to be optimised or restricted to 1 or so pairs it is imho not good enough.
 
Krzysztof,

Since part of ELM algorithm is random ( setting of the input weights and hidden layer bias ), output results of same activation function and same number of hidden neurons may change...

Know you fix this part of ELM ?

Regards.

Yes, some of the algos can give different results on the same data set due to random activation however for ELM final result didn't vary much. However for LDKL algo which was very fast, variance of the final result was so big that I had to trow it away from my algo group (even that it internally was making voting ensemble). I believe its something with its random initiation but I didn't look much to this.

Krzysztof
 
Top