3rd generation NN, deep learning, deep belief nets and Restricted Boltzmann Machines

Krzysiaczek99

So the CHIRP classifier is the best or ? but the input/output are primordial for a good prediction.
 
That google deepmind algorithmic software is brilliant on 70s and 80s games but can it be transfered to the trading markets ? Anyone interested in this development ?
 
Dekalog ,

I share some very similar ideas with you.

Calculate the signal's MAE/MFE as a percentage(Edge Ratio).Use this ratio as signal to noise ratio.Set a threshold(edge ratio of over 1.5 is very good signal).Match the signals to the past data(the longer the data the better).For example emerge the best signals O-H-L-C relationship and squence of consecutive bullish-bearish bars.I get little lost in here.Then get the distribution of values of edge ratios of the signals.Match the past signals datas to future data.

The idea of using the future distribution of values of Edge Ratio(MAE/MFE as a percentage) of the signal as input for machine learning algo has been digging my head for long time.How does this idea effect the overall equity curve?
 
life tests

I made some life testing of the improved version of the system from 06.04 till 01.05
In total more than 15k trades was done over 8 symbols i.e. EURUSD, AUDUSD, GBPUSD, XAUUSD, AUDJPY, GBPJPY, USDJPY and US500 and here are the results.
 

Attachments

  • total.jpg
    total.jpg
    162.8 KB · Views: 313
  • total.htm
    4.3 KB · Views: 300
per symbol

seems that efficiency depends a lot of the instrument and US500 is definitively a leader.
 

Attachments

  • symbols.jpg
    symbols.jpg
    174.9 KB · Views: 234
  • symbols.htm
    15.8 KB · Views: 271
open trade time

looks also that open trade time is very important i.e. trades opened during London or US session are profitable, in between rather not.

I will continue life test over May to confirm stability and going also add major improvement which according to back test results should improve profit factor dramatically.

Krzysztof
 

Attachments

  • hours.jpg
    hours.jpg
    184.3 KB · Views: 228
Deep Learning for Multivariate Financial Time Series

and here is a paper 'Deep Learning for Multivariate Financial Time Series'. I think is pretty good one, at least all methodologies are in one pdf. As per results the author took huge training set and if he would have some experience in predicting financial TS than would know that for such big size training he will lose prediction resolution

This gives an input matrix of dimension 134
350 x 33 and a vector of 134 350 labels.
The training data was partitioned as follows:
- 70% of the data for training
- 15% of the data for validation
- 15% of the data for testing

the article which describes the phenomena of losing prediction resolution
is here

https://www.mql5.com/en/articles/1506


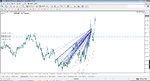
An insufficiently wide window for immersing into the lag space cannot provide such information, which, naturally, decreases the efficiency of forecasting. On the other hand, expanding the window to such values that cover the distant, extreme values of the time-series will increase the network dimensions. This, in its turn, will result in the decreased accuracy of neural network predictions - now due to the network growth.
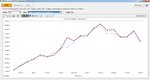
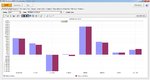
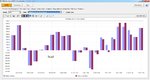
So there is no surprise that the results were bouncing around 50%

Model Neurons p f EV (%) ET (%)
Naive - - - 50.03 50.93
LReg - - - 49.96 50.74
MLP 20 - 0.1 49.66 50.84
DBN 400 10 11 10 3 46.52 47.11

Perhaps much better would be to take much smaller training size and repeat evaluation with 'walk forward' . It would give much more results and in such case it would be possible to compare performance of DBN versus other methods more accurately.

Anyway, all is in one place, have a nice reading.

Krzysztof
 

Attachments

  • Deep_Learning_for MVFTS.pdf
    2 MB · Views: 1,206
Nice Krzysztof.

For April and May, it's a walkforward test ? and June / July still good ?

Average 2500 trades by months / by instruments it's very very lot of trades !! :) the system run on 1 mins bars ?

It's not walk forward, it was tested live on demo account. For June is off - summer break. it runs on 1 min bars.

Krzysztof
 
backtest overfitting/inflated sharpe ratio

Here are some links with info about backtest overfitting which can explain why strategies works than stop to work. Training of NN can be considered like multiple testing because on every epoch the new model is created. I believe is very hard to avoid all those biases and only life testing with a lot of trades can verify is something is really working

Krzysztof

http://link.brightcove.com/services...NGP7d&bclid=2204845638001&bctid=3878525144001

https://www.youtube.com/watch?t=13&v=KKduDAbZ4Uk

http://eranraviv.com/multiple-testing/

http://www.financial-math.org/

see also David H. Bailey, Jonathan M. Borwein, Marcos Lopez de Prado and Qiji Jim Zhu, "Pseudo-mathematics and financial charlatanism: The effects of backtest over fitting on out-of-sample performance," Notices of the American Mathematical Society, May 2014, pg. 458-471
 

Attachments

  • backtest-prob.pdf
    1.1 MB · Views: 1,054
  • deflated-sharpe.pdf
    1,023.6 KB · Views: 727
feature extraction

In order to improve the performance of my system i decided to add feature extraction to the system based on Mutal Information. But will it help ??

According to this article feature extraction should be applied for SVM classification.

http://www.researchgate.net/post/Do..._classification_using_SVM_improve_the_results

So I made an experiment. I feed to my system simple sin signal than classify using SVM and tree algo C4.5 with and without feature extraction. I checked following FE algos

JMI - joint mutal information
CMI - conditional mutal information
MRMR - maximum relevance maximum redundancy
FCBF - fast correlation based filter

and here are the result. Firs is always SVM classifier 2nd is C 4.5

no Feature Extraction

NORMAL DATA AVERAGE RESULTS
Profit PF avMC avPP avRC totTP totFP
53130889.76 3500.00 0.68 98.13 0.96 1783 34

NORMAL DATA AVERAGE RESULTS
Profit PF avMC avPP avRC totTP totFP
53997644.78 27000.00 0.88 98.17 1.00 1825 34


mrmr

NORMAL DATA AVERAGE RESULTS
Profit PF avMC avPP avRC totTP totFP
39038901.09 14.00 -0.09 84.26 0.83 1413 264

NORMAL DATA AVERAGE RESULTS
Profit PF avMC avPP avRC totTP totFP
53997644.78 27000.00 0.88 98.17 1.00 1825 34


cmi

NORMAL DATA AVERAGE RESULTS
Profit PF avMC avPP avRC totTP totFP
54466031.24 610.00 0.77 97.91 0.99 1828 39


NORMAL DATA AVERAGE RESULTS
Profit PF avMC avPP avRC totTP totFP
53997426.49 24000.00 0.88 98.17 1.00 1825 34

>>

jmi

NORMAL DATA AVERAGE RESULTS
Profit PF avMC avPP avRC totTP totFP
53795200.98 61.00 0.48 95.15 0.99 1824 93

NORMAL DATA AVERAGE RESULTS
Profit PF avMC avPP avRC totTP totFP
53997013.46 21000.00 0.88 98.17 1.00 1826 34

fcbf

NORMAL DATA AVERAGE RESULTS
Profit PF avMC avPP avRC totTP totFP
47340909.80 84.00 0.17 94.12 0.88 1617 101

NORMAL DATA AVERAGE RESULTS
Profit PF avMC avPP avRC totTP totFP
53997835.99 30000.00 0.89 98.22 1.00 1826 33
 
Last edited:
So clearly Feature Extraction based on MI decreased the performance for SVM. Number of false positives totFP (failed trades) grown comparing to no feature extraction, Profit and Profit Factor decreased and % profitable went down. C 4.5 performance seems to much less affected and for fcbf algo got even improved. This analysis is valid just for test sinus signal.

Krzysztof
 
feature selection

Here is the example of practical application of feature selection for trading. Below the results of 6 algos for 2nd week of October. From below you can see
that combined PF is just 0.28 and none of the algos during this week was profitable. Test was done against 8 symbols EURUSD, GBPUSD, AUDUSD, XAUUSD, USDJPY, GBPJPY, AUDJPY and US500, 1 min data for 5 days. So in total 18 day/symbols of 48 was profitable

Code:
>> resultsAll('*info=OS')
resultsAll('*Peg*info=OS')
%resultsAll('*LMT*info=OS')
resultsAll('*CHIRP*info=OS')
resultsAll('*J48*info=OS')
resultsAll('*RBM*info=OS')
resultsAll('*SDAE*info=OS')
resultsAll('*ELM*info=OS')
   NORMAL DATA AVERAGE RESULTS
      Profit           PF         avMC         avPP         avRC        totTP        totFP         PF>1     algosnum           SS          SSl
 -8201988.60         0.28        -0.13        40.48         0.30        48088        67319           18           48            1            5

   NORMAL DATA AVERAGE RESULTS
      Profit           PF         avMC         avPP         avRC        totTP        totFP         PF>1     algosnum           SS          SSl
 -1425720.10         0.46        -0.07        45.27         0.67        17110        20442            3            8            1            5

   NORMAL DATA AVERAGE RESULTS
      Profit           PF         avMC         avPP         avRC        totTP        totFP         PF>1     algosnum           SS          SSl
  -230347.50         0.72         0.02        49.34         0.42        11234        10835            4            8            1            5

   NORMAL DATA AVERAGE RESULTS
      Profit           PF         avMC         avPP         avRC        totTP        totFP         PF>1     algosnum           SS          SSl
 -1428701.90         0.29        -0.31        37.84         0.34         9935        15637            3            8            1            5

   NORMAL DATA AVERAGE RESULTS
      Profit           PF         avMC         avPP         avRC        totTP        totFP         PF>1     algosnum           SS          SSl
 -1401488.00         0.25        -0.19        32.07         0.05         1704         4577            3            8            1            5

   NORMAL DATA AVERAGE RESULTS
      Profit           PF         avMC         avPP         avRC        totTP        totFP         PF>1     algosnum           SS          SSl
  -664451.40         0.04        -0.04        43.87         0.08         1945         3097            3            8            1            5

   NORMAL DATA AVERAGE RESULTS
      Profit           PF         avMC         avPP         avRC        totTP        totFP         PF>1     algosnum           SS          SSl
 -3051279.70         0.12        -0.15        34.88         0.25         6160        12731            2            8            1            5
 
after FS

after applying of feature selection algo fast backward correlation picture is changed. Total PF is 0.88, 2 algos has PF>1

Krzysztof

Code:
>> resultsAll('*info=OS')
resultsAll('*Peg*info=OS')
%resultsAll('*LMT*info=OS')
resultsAll('*CHIRP*info=OS')
resultsAll('*J48*info=OS')
resultsAll('*RBM*info=OS')
resultsAll('*SDAE*info=OS')
resultsAll('*ELM*info=OS')
   NORMAL DATA AVERAGE RESULTS
      Profit           PF         avMC         avPP         avRC        totTP        totFP         PF>1     algosnum           SS          SSl
 -1009737.10         0.88        -0.25        42.50         0.30        56823        70550           18           48            1            5

   NORMAL DATA AVERAGE RESULTS
      Profit           PF         avMC         avPP         avRC        totTP        totFP         PF>1     algosnum           SS          SSl
  3846525.40         9.13        -0.18        51.49         0.51        17019        14046            5            8            1            5

   NORMAL DATA AVERAGE RESULTS
      Profit           PF         avMC         avPP         avRC        totTP        totFP         PF>1     algosnum           SS          SSl
  -833498.20         0.16        -0.29        36.76         0.21         6640        10995            4            8            1            5

   NORMAL DATA AVERAGE RESULTS
      Profit           PF         avMC         avPP         avRC        totTP        totFP         PF>1     algosnum           SS          SSl
 -1428701.90         0.29        -0.31        37.84         0.34         9935        15637            3            8            1            5

   NORMAL DATA AVERAGE RESULTS
      Profit           PF         avMC         avPP         avRC        totTP        totFP         PF>1     algosnum           SS          SSl
   157205.60         1.13        -0.11        49.69         0.33         9886        10516            4            8            1            5

   NORMAL DATA AVERAGE RESULTS
      Profit           PF         avMC         avPP         avRC        totTP        totFP         PF>1     algosnum           SS          SSl
 -1739003.00         0.16        -0.37        27.87         0.10         2577         6568            0            8            1            5

   NORMAL DATA AVERAGE RESULTS
      Profit           PF         avMC         avPP         avRC        totTP        totFP         PF>1     algosnum           SS          SSl
 -1012265.00         0.53        -0.28        43.12         0.32        10766        12788            2            8            1            5

>>
 
funny example

Long time no speak !!! But research and hard work is still going on !!!

here is the example how trading done by this system is different than human way of trading. It started to trade long around 8am today, around 15.30 i closed all trades manually (after first spark of price), than system was still predicting long and open another long sub trades, than after pullback next spark again !!!!

Just wonder if it was just luck or it was so smart....if I would not intervene and close seems too early it would make much more money as all closed sub trades were long.

Krzysztof
 

Attachments

  • zzz.jpg
    zzz.jpg
    242.1 KB · Views: 487
Top