1-2-3-Formations and Ross Hooks

Can anyone point me in the right direction on this one.

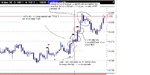
It is a chart of Gold. The Hook and correct 1-2-3 formations have been shown in black.

I am not familiar with this instrument so do not know if the price axis of 1 point is actually 1 point or represents moves of 100 like indices.

Anyway can anyone tell me why save for the alternative 1-2-3 formation being to narrow for this time frame as to why the 1-2-3 and Hook which breaks the trend, why the selected 1 or 3 could not form a TTE in its own right.

I will understand if the point range is to narrow, if on the other hand the price axis is in 100's as in the case of the Dow cents then I would consider that range suitable. It certainly was a good trend buy because you have something to aim for with the old test of the down trend marked in brown already on the chart to work from.
 

Attachments

  • vol_43.gif
    vol_43.gif
    9.8 KB · Views: 622
ardhill

Thanks for reply. As to the Hook example that we were working from earlier would you have entered on the first Hook in the uptrend and then used a trailing stop or continued to move the 1-2-3 sequence in order to establish further Hooks within the rise. I ask purely out of interest because I do not trade this particular instrument.
 
For balance i just want to offer an alternative view.

At the moment in these markets there is no statistical benefit for trading the break out of some obvious plays.

Although the break out is still a valid tool in the traders armoury especially when the stock/currency/index is trending strongly.

Emotionally however these break out moves excite many and when they fail some will get in denial and hold on to them in the belief that they are doing something that is supposed to work,only to suffer large losses as the move collapses away from them.

Look for instance at Exon Mobile it attracted massive downward pressure as soon as it broke out above $64.The word on the wires almost immediately was "XOM sudden drop attributed to a 14 mln block of stock being executed" There was more profit in fading the break out than playing it.

To me traders might benefit from moving on from the stronger older ways of thinking and add some extra tools in their trading kit.Of course this is just a personal view yours may be completely different.

Naz
 

Attachments

  • xom.gif
    xom.gif
    10 KB · Views: 443
Naz

In view of your last post I take it that the previous chart was also an alternative approach.

There is IMHO nothing wrong with having a wider avenue to trade the market from and at the same time if you follow a strategy that works more than it fails that also is fine. Being dependant on a single approach just means you spend more time out of the market waiting for the right set-up to come along that meets your criteria. When it comes along it does not mean it will work but that it has a good probability of working. If it should be a false signal then the stop keeps you safe and it gets put down as one that did not work out. We then go back to waiting again. Nothing wrong in that.

I have put a couple of extra lines on your chart and agree there was a false breakout. It all really depends on what time frame you trade and I can see someone trading from EOD who place a buy order with the market the previous evening would miss the warning signals during the sell day. For that individual this would fall into one that did not work this time. However I feel the real benefit of the 1-2-3 and Hook concept is when the trend changes. It would therefore be interesting to see more of the chart which might suggest an early buying opportunity and the breaking of $62 the stop.

However for me this is a popular set-up on intraday trading, I do not trade the daily time frame. As you highlight the top at $64 is the testing area. The 2nd failure to pass this after the move up from $62 is another clue to a possible sell IMHO. With the accelerated trend line broken when $64 is passed but then returns especially if rapid then this is a clear failure to hold this level and a good sell at least short term IMHO. With a tight stop just above $64, all this from your chart applying the pattern to a simple intraday trend approach.

I have added another chart which paints an easier picture to make assessment of what to expect. The daily chart coving a year. This provides a very different picture and I have taken the liberty of placing in what I feel are relevant points. First and most obvious this share has been in a tremendous up trend. The breaking of $52 and the manner in which it was broken is a popular sign of strength. I have placed a 1-2-3 set up with a potential Hook around $56 alternatively another at $60 if my Hook assessment is not correct.

I have then added my own approach which is to view price in individual movements and I see that to reach $64 the price made 3 significant pushes up. As I am sure you are aware the figure '3' is very popular and often tends to be the last move before a retracement / correction or trend change. Therefore the picture is now one of a potential very strong sell on the 2nd $64 failure and an absolute must on the reversal bar. This chart also shows that trading from this time frame someone following the Hook method would have entered this one much earlier in the trend and have made good profits even after the recent news. I would admit for me the Hook is a late signal but also helpful when situations are unclear, it is a fall back method for me but this chart shows on this ocassion it would have worked well.

The 2nd chart is 60 min for a closer look if trading from this time frame or using it in conjunction with the daily. It only covers 10 days but I have shown possible Hooks for intraday profit and considerations for getting out and or selling according to the trends within this time frame.

The final chart 1 min shows there was very little chance to avoid getting out of a trend following intraday deal using other methods of entry than that of the Hook, but there appear to be opportunities to get out in the $63 range.

I suppose this has become a mini study reply and shows that it all depends on what time frame and your method of trading. What appears obvious in one window when analysing a method can appear very different in another.
 

Attachments

  • 1yr.gif
    1yr.gif
    25.2 KB · Views: 428
  • 60 min.GIF
    60 min.GIF
    39.8 KB · Views: 410
  • 15 min.gif
    15 min.gif
    37.9 KB · Views: 433
  • 1 min.gif
    1 min.gif
    39 KB · Views: 377
Hi Kev


Remember The 1.2.3 method has been around since 19.. its nothing new to the trading world.

As for the hook. all it is really a fancy word for buying strenth.in an up trend or down trend. after confirmations of a 1.2.3 of a breakout of a congestion area

sun
 
Sun

Yes I can see that, I suppose what it offers is another test by which to judge an existing trend relying on higher lower pivots in an up trend or lower high pivots is a down trend for support of the existing trend or further entry positions.
 
A Ross Hook:
1) First failure to continue direction following breakout of a 1-2-3.... so you've rebounded from the 3 point then seen another 'pointy bit'. If it's a 1-2-3 low, ie 1 and 3 are lows, 2 is high, then you climb from the 3 point seeing higher highs, higher lows, and you get a bar (could be a double top) that goes lower, leaving the previous bar sticking up.

2) First failure to continue direction (as in (1) basically) following breakout from a ledge

3) As per 2, but following a trading range

When looking at diagrams in 'Daytrading' it's evident that the term 'first failure' is largely meaningless, as subsequent, similar formations are also called Ross Hooks within the same uptrend/downtrend... ie it's not only the first such bar that is called a Ross Hook, they all are.

Anybody else here got 'Daytrading'? Is it just me, or are the charts a bit iffy at times? There seem to be duplicate charts for no apparent reason - an example being those on pages 116-117, a degree of repetition early on, and it would help if the end of each day were shown on the chart - the text sometimes says things like 'it opened lower the next day' which tends to make limited sense if the days aren't marked so the bar in question can be noted - I've found it less than obvious at times when trying to decide the timeframe of the chart in fact... quite a few early on are devoid of notation, just when you need it most... it tends to improve later on.
 
Dave

One Eyed Shark has the book and I am at the stage of considering buying it. From your comments unless I have made the wrong assumption you are not entirely happy with it. What is your overall view and does it support or detract from your existing day trading method.

ps we seem to be following one another today,LOL
 
JB

Agree that charts could be a bit more explicit, though like the fact that charts are repeated on each page there is dialogue about them, just personal preference I suppose.

sun123

Accept both your points i.e. 123 has been around a lot of years and RH is buying/selling strength/weakness in a market.

Can't understand how that is relevant to the overall success or failure of the pattern.

I also follow Wyckoff styles of trading and am sure if he was around today he would say it is more relevant now than it has ever been.

We often try to over complicate trading simply because we have the technology to do so, in no shape or form does that detract from from what has worked historically and what works today.
 
Ah,
not really accurate on the 'not entirely happy with it' side, that would be a somewhat harsh statement and I am still reading it. It seems, so far, about what I expected - I've read rather a lot of books, I'll get wildly enthusiastic when I start having to bury the money in the garden 'cos the banks are full.

I'd say some of the early charts could stand having 'daily' or '5 minute' or similar written on them, on occasion it's taken me a bit of a while to confirm which I am looking at, and there are repeat charts on consecutive pages which aren't always intentional (p134/135 for example, the text clearly suggests the chart on 135 is meant to have a boxed section added). I'd class these as fairly minor niggles - not something that would put me off buying the book.

Whilst I have yet to finish it, I am happy to have added it to my collection, it's an interesting read, and I'll be looking to see if what I learn from it is of use in my trading. Like any other book it will be a while before I have any idea how it'll affect me -

Following , yes - I've had the PC running for email as usual, and posts on threads I watch pop into the in tray.... as it's a fairly easy day today I invariably follow the link back for my 300th visit of the day...<g>
 
One Eyed Shark

When using the 1-2-3, Hook TTE method with the 1 minute time frame does it tend to follow that with the faster updates that positions on this time frame will appear within a narrower range. For example on the FTSE this morning I could not see such a formation on the 5 & 15 min time frames which I use. However I am starting to back these up with the 1 minute time frame and there has been a Hook formation and if traded (I was tired so gave this morning a miss) produced reasonable profit.

This was a sell set up with point 1 at 4992, point 2 located at 4983 and point 3 at 4987. The Hook was seen at 4778 and the TTE entry range 4981 - 4778. Only a range of 3 points. You might be pleased to learn that this deal would have been profitable even for the sleepy FTSE making a quick low in 10 mins at 4965 and approximately 11 - 14 points profit subject to entry and exit.

The 2nd question has to be that when using the Hook method in terms of price range seen within the formation must be dependent on the peculiarities of the instrument. For example using this on a more volatile instrument such as US markets or the FX then the price ranges I have just quoted would probably be to narrow. But with the FTSE which does not move a great deal by comparison often with a daily range of between 20 - 40 points these levels of price movement to form this mornings set-up would be of significant size according to this instrument.

3rd question

Because the Hook method gets you into a trend quite late, using the stats from the above example the fall started at 4992 with the entry between 4981 - 78 some 11 - 14 points later which for the FTSE is quite a lot.

Does it follow that after the Hook entry and you reach that first profit taking area where we see another low bar ( in a down trend creating a lower Hook ), that there is a high probability at this stage that the price is moving towards the end of the trend but generates a last sell when the price first retraces against your entry position after a lower Hook that the next test of the price is where you might see the down trend line of the bar tops broken but not the full trend. That the price creates that situation where it rises back up but fails at a resistance level created in the down sequence earlier. You then see the price drift lower from this position and often the last throws of the down trend before it is broken properly.

It may seem a daft question but this is how I have observed the FTSE to frequently produce an end to a downtrend meaning that when the price attempts to move back often after a Hook method entry is seen and produced profit if the resistance is not taken out there is another good sell as the price will either retest lows, continue the trend or move at least towards the low and there is often sufficient room for reasonable profit.
 
Kevin

Have read your post, but will look into it a bit deeper after the close and if neccesary edit comments accordingly.

1st question.

Yes, postions taken off the 1 minute chart will appear in a narrower range.

Each instrument has its own personality and I try to find the shortest timeframe that instrument can be safely traded without giving too many false signals.

It also follows that a position taken off the 1 min will have a much smaller target and stop loss than that taken off the 5 min, and the same applies 5 to 15 min.

The best trades for me start off as entries on lower time frames that turn profitable very quickly and can then be managed of the longer timeframe.

2nd question

Not too clear on the point ?, the important thing about the RH for me is not the potential points target but the potential win/loss.

As it is a high win/loss pattern I will usually set targets at 6-8 ticks on US indices and trade size to get $ target with lower risk from small tick target.

3rd question

Difficult for me to look at a chart as I do not subscribe to UK data.

The probability for a RH failure will increase as the trend continues, the 1st is safe and will usually print you biggest moves ( essentially it is wave 2 in elliot wave talk ) the 2nd presents more risk though is highly tradeable ( wave 4 in EWA ) after the 2nd RH I will be very reluctant to trade that pattern unless it starts to print as the 2nd RH on a longer timeframe.

Hope I have not confused the issue ............. :|
 
One Eyed Shark

Thank you, 1-2-3 all answered.

Just to clarify question 3.

I understand that because the Hook entry is a high win probability you set quite small but realistic targets for a later move within an existing trend. You trade at a level that the small price move will generate a reasonable to good return.

In respect of question 3. If I understand you correctly you will try to see a Hook entry set-up from the faster time frame. Should the move develop well you then manage your position from the longer time frame in order to reap more from the trend by allowing the deal to run on.

Therefore when you get a situation where you have entered on a TTE the position moves as expected and you find yourself in a good profit from what on the chart is the next move down. Assuming you have got your profit and closed do you consider selling again when the price fails the first time after you have got out from a position higher than where you closed or do you start the process all over again of trying to establish a new Hook TTE entry, either by shuffling the existing points used or using new 1-2-3 formations etc.

I hope this is not to daft just trying to get my head round trading this through the trend after initial entry other than just holding until the trend changes.
 
Kevin

Once I have entered a position and taken profit each new entry has to be taken from scratch again i.e. 123/RH with TTE or any other pattern I trade.

That is just my rules nothing to say it is the best way.

Thing with this style of trading is that entries are black and white, but money management takes us into various shades of grey subject to our attitudes and tolerances as traders.

Have posted my trades from YM ( 2 min ) for last 40 mins of todays trade, quite relevant to earlier comments.

Tough day today.................
 

Attachments

  • monday.JPG
    monday.JPG
    75.1 KB · Views: 497
Last edited:
One Eyed Shark said:
Kevin

Once I have entered a position and taken profit each new entry has to be taken from scratch again i.e. 123/RH with TTE or any other pattern I trade.

That is just my rules nothing to say it is the best way.

Thing with this style of trading is that entries are black and white, but money management takes us into various shades of grey subject to our attitudes and tolerances as traders.

Have posted my trades from YM ( 2 min ) for last 40 mins of todays trade, quite relevant to earlier comments.

Tough day today.................

Nice trades OES.

I see you use TG. How do you implement the VSA signals into your trading plan?

Also, how do you define a cengestion zone (One of Mr Ross' definitions?)?

Your trades are as taken right out of the book, or at least the TLOC PDF ;)

Hope you'll posts some more of your trades the next couple of weeks. Interesting stuff.

Take care.
 
One Eyed Shark

Thanks for this it puts our discussion into context. Clearly for the Hook to provide the points you require a good trending period. In this case the best part of 50 points from top to bottom today and then you take something from the move like most traders using different methods.

Do you apply alternative strategies to assist with these moves.


I post this not as a suggestion that what you have done is wrong far from it, you took profit so well done especially if you had to be patient for most of the session in order to get the right conditions. That illustrates good discipline. My comments are just for discussion nothing more.

When I look at the chart you have posted I see where my own set up would have entered but I doubt that I would have got anywhere near the top without closing and entering again as you have done. I often think we may take to much notice of the flickering price and how much we are up or losing instead of just concentrating on where the price is actually being plotted within the chart. Easy to say after the event I know but imagine the discipline to enter and manage the deal from the start of a trend or your set up and see it through to near conclusion or at a position within the trend that you were content not to take more deals. We all know how to read charts but I suspect rarely do we see a deal out most of the way but take more deals as the price continues to do what our first deal said it would. A simple trailing stop would do it but once we have profit and see the price turn it becomes very difficult not to take what you already have IMHO. This chart clearly falls into that category.

The Hook method is about high probability taking a small piece of the cake and being able to eat it. You must have seen these conditions numerous times. Could you trade this price movement with more than 1 method such as entering the trend either earlier or at the same time as the TTE but managing the position differently. For example continue to take your normal points with 1 but let the other run, if the trend continues you benefit from the further move. You could enter again as you have today playing the full trend by both methods or adopt a stance of when the 1st target is banked that acts as the safety for what is left in. Or is such a suggestion just making the whole thing to complicated.

I reiterate I am not saying this to get at your method but discussing something that I have seen numerous times and wonder if it could be traded more affectively than applying a single approach as we do using our different methods. The results are about the same, we take several deals getting sections of the overall move. I would welcome your thoughts on this as you obviously experience these conditions frequently as I do. It is not about trying to take it all but trying to make the most of a trending situation when they appear to cover those times when the trends do not develop. Or is this an inability on our part to trade at a higher level where seasoned trades can take a position and ride a trend or at least 3 of its price moves before getting out.

Regards

Kevin
 
OES and Kevin.

Keep posting you two, I am realy enjoying this,I can see set ups now that I was not aware of before and am using your methods now, when I look at charts.I am trading with EOD charts with FTSE stocks and can see these 1-2-3 set ups and am slowly understanding the hook method.

Regards.
 
Fluke

I am pleased you have found the posts of benefit. Mind you I am not an authority on this method and my charts are likely not to follow the method exactly but I have been using 1-2-3 for a long time with trends. The Hook for me is an addition to the Arsenal for re-joining a trend or remaining in one. But this is contrary to the true Hook method and this thread is about that so you will find I enter earlier using trend signals you must not confuse the 2 if your intent is to follow the Hook method correctly. It is as those that use it have said a safer method because of its high probability.

However I also think this is an issue I would discuss. As OES said the other day the later you join a trend the greater the risk and I suppose the same could apply the earlier you join. However and this is only my opinion but when day trading you are trying to benefit from that day's momentum. When a trend changes it takes time, the price starts to challenge the trend by pushing against it and we see how the price appears to move further against the trend and less with it towards the end. Creating 1-2-3's alone the way.

Eventually the trendline breaks and the price moves above it only to fall back. If the price holds above or around evens to it last position within the trend then there is a reasonable chance the price will move up. There is off course another signal where the trend actually goes lower giving the impression of the trend continuing, this is where the extended trendline comes into its own. Anyway the price then move up from these levels at this point the momentum for the new trend is in its infancy but offers good potential just as the Hook does. It is about how far it will go, we can only surmise that it will challenge point 2 however in most trends that have run for some time those 1-2-3's towards the end of the trend get smaller and often when the trend breaks up after confirmation it take sout the near point 2 and goes onto challenge a resistance area formed as the trend was falling /rising. This becomes the next test if this new trend will continue or not. But these moves are enough to be traded just like the expectation behind the TTE towards the Hook imho. You have entered a trend change at a time when the momentum is at a strong stage. The set-up is that the longer the existing trend has been in force or the greater the distance the price has travelled the better the chance that this signal will not be false. Therefore intraday trends in place for 90 mins or more will have a higher probability than those of 30 mins or those that have fallen 40 points more than those that have fallen 15. It is like a bouncing ball analogy what goes up must come down and what goes down must bounce at some stage. Taking something from these moves IMHO is just the same as taking something from the TTE to Hook or more. The same risk applies in the Hook as it does with regard to point 2 being reached. The trend could run out of steam and the Hook is not reached. The difference with the Hook is for the Hook to be seen the trend is more established and presents a stronger trend is the formation as OES again has highlighted is stretched out. When the formation is seen like that it displays a strong trend environment and I would agree a very strong opportunity for profits. The Hooks can be seen in different circumstances where the price is not so stretched and they although may produce profit just like the point 2 approach offer less opportunity. That is why when I lok to enter a trend early I take not of how far the price retraced against the trendline to break the trend and if it also reached or took out resistance before falling back. This would be the same for me as OES having a price formation with the relevant points stretched out producing a strong trend.

When conducting research into new methods I look to see how something might improve my existing set-up rather than to change completely and for me the Hook does this. Good luck with your trading.

Regards

Kevin
 
Skog
I do not use Tradeguider to filter JR trades, I also trade a number of candle/volume reversal patterns for which I use Tradeguider i.e. Bearish/Bullish Engulfing and Harami etc.

For congestion I just eyeball the chart no science to counting bars etc

Kevin

I take a portion of contracts off at target and leave runners for the remainder, in yesterdays action the first YM trade took part off at +6, I then pulled stop for remaining to +6 and market took me out.

That is the difficult thing of looking at closed bars you see where it starts and finishes but you cant get any idea of price action in between.

That is why I like to see long bars after RH profit is in bag and protective stop on runner is not too close to current price action.

Nice 123 printed on 2min YM today also confirmed by 5 min @10.00 EST, good for a few points in either timeframe
 
Top