1-2-3-Formations and Ross Hooks

As far as I am concerned, you are right the first chart isn't a 1-2-3, and the second one is.

How long do you wait?

After number 2, you have a pullback, as long as it is pulling back, you don't enter as you don't know what it is going to do, for all you know it could keep going down further than your first bar - that would then invalidate your original number 1 bar. Anyway, you wait for it to pullback - it doesn't make it as low as the number 1, then starts to climb again.

For me, I would enter when the high of your number 3 point was breached, my stop would be just below the low of number 3 bar. This is how long I would wait, others will wait until the high of the number 2 bar is breached.

If intra day though, It would be a Nasdaq stock and I would be watching the L2 screen, that way I have more chance of being able to see the likely trend of the stock.
 
Skog said:
Less action in this thread today so I thought I'd post an image of the current price movement in the mini dow.

attachment.php


This is a nice 1-2-3 on the 10 minute chart (Andy Jordan, a trader at TradingEducators uses this timeframe frequently).

By applying the TTE an entry would have been placed at 10456 (the green line) around 9:30 (Chicago Time) and by placing a stop right below the #3 (the lower red line) we risk 16 points.

Maybe Joe Ross would have managed this trade another way, but by placing a target at 10488 we get a Reward:Risk of 2:1. I would just once again like to mention that I don't know if Ross would have managed this trade this way.

So, a nice 1-2-3 low that acted just like Ross says in his books ;)

As I'm writing this post I also see that the last bar on the chart I've uploaded actually was the first RH in this uptrend, but it hasn't yet been broken.

Skog

(P.S If anybody was wondering, I didn't trade this setup. Just watched it eagerly :cheesy: )

Skog

Nice trade but I don't think it's a TTE. The ross hook comes after a break through the 2 point and TTE follows via the correction that creates the ross hook. TTE is just above the high of the first correction bar (or the high of subsequent bar if correction deepens).

In fact no ross hook has yet appeared in your example as far as I can see.

good trading

jon
 
barjon said:
In fact no ross hook has yet appeared in your example as far as I can see.

A Ross Hook is just the last bar that made a new high. If a bar makes a higher high and the next bar makes an equal or lower high we have a Ross Hook. The RH doesn't have to be taken out to be a Ross Hook (You could use the TTE), but it's not a very profitable RH.

As for the TTE, In my opinion the TTE is a buy of the breakout of one of the first two/three corrections off the #2. I'll re-read the PDF later today to be sure.

Skog
 
While we are on the subject...

Anyone here have a full copy of "Trading The Ross Hook" or any of his books on equity trading in the Electronic Trading TNT series that they would like to part with for a reasonable price?

PM me if you do with a price for UK delivery.

Thanks


Update: I have now received a copy of Trading The Hook Ross
 
Last edited:
Skog said:
A Ross Hook is just the last bar that made a new high. If a bar makes a higher high and the next bar makes an equal or lower high we have a Ross Hook. The RH doesn't have to be taken out to be a Ross Hook (You could use the TTE), but it's not a very profitable RH.

As for the TTE, In my opinion the TTE is a buy of the breakout of one of the first two/three corrections off the #2. I'll re-read the PDF later today to be sure.

Skog


try page 33
 
Skog - I agree with your interpretation of the RH and TTE. However, from personal experience, I would often take the trade described by Barjon. In fact these are the original 1-2-3s described in JRs first book. These was only half a page of limited description given to the RH in his first tome. (This first book is excellent BTW but concentrates on break outs from prolonged trading ranges and trading inside these ranges if there's enough room)

Back to the point and using Barjon's post to illustrate. I have found that the move up past the no. 2 point is often so powerful that by the time a RH is formed AFTER the no 2 then the move is all but over. Barjon's chart is an excellent illustration of this.

Horses for courses I suppose - I am just often frustrated waiting for a bone-fide RH to be created after a successful 1-2-3 and, when it eventually does, the result is little more than break even.

BTW entering TTE before the last RH of ANY established trend if also often very profitable and low risk. Just use very close stops (last low normally)

I am very pleased that Roberto started this thread - it's amazing how many JR fans there are. Has everyone seem the free material on:

www.nqoos.com/Articles_and_Reprints.htm

Some gem set-ups surrounded by lots of waffle. . . but it's free so can't grumble.

Cheers
 
barjon said:
try page 33

barjon,

didn't find anything interesting on page 33, just a picture of a bearish Ross Hook after a ledge.

But this was what I found on page 10 og the TTE PDF:

"Once a #2 point is in place, we want to buy a violation of the high of any of the correcting bars that form subsequent to the #2 point."

These are the exact words of the author.

So why wasn't what I did a TTE? I did just as explained on page 10.

Since you was referring to page 33 we may be watching different PDFs. Try downloading the latest one from TradingEducators.com. I'll do the same now ;)

Skog
 
fastnet said:
I am very pleased that Roberto started this thread - it's amazing how many JR fans there are. Has everyone seem the free material on:

www.nqoos.com/Articles_and_Reprints.htm

Some gem set-ups surrounded by lots of waffle. . . but it's free so can't grumble.

Cheers

Good to hear from experienced users of these setups. The examples in the books are, mostly, always pictures of perfect setups, but when it comes to real life trading nothing is that simple.

I also have a link that I would like to share:

www.direct-equity.net/forum/display_forum_topics.asp?ForumID=14

Joe Ross has his own column at DirectEquity.net where he frequently posts his "tidbits" which he also posts in his free weekly mails.

Not many charts, but you get to know the trader Joe Ross a bit better.

Skog
 
Skog said:
barjon,

didn't find anything interesting on page 33, just a picture of a bearish Ross Hook after a ledge.

But this was what I found on page 10 og the TTE PDF:

"Once a #2 point is in place, we want to buy a violation of the high of any of the correcting bars that form subsequent to the #2 point."

These are the exact words of the author.

So why wasn't what I did a TTE? I did just as explained on page 10.

Since you was referring to page 33 we may be watching different PDFs. Try downloading the latest one from TradingEducators.com. I'll do the same now ;)

Skog

skog

That's a quote I haven't got in my version :LOL: It's perfectly valid entry point though as is the TTE principal of expecting the price to at least challenge the 2 point (not just from a Ross 1-2-3 perspective as db pointed out earlier "from the Wyckoff perspective") - but it's not trading a ross hook.

In relation to 1-2-3, a ross hook is created by "the first correction following the breakout of a 1-2-3 high".

My (presumably older) version talks only of either buying a "break out of the #2 point" or waiting for a ross hook and using TTE in relation to that ross hook.

In essence I suppose it matters not a jot. All 3 are decent entry points with differing risks as suits each individual.

good trading

jon
 
barjon said:
My (presumably older) version talks only of either buying a "break out of the #2 point" or waiting for a ross hook and using TTE in relation to that ross hook.

Barjon,

if I understand you correctly you're saying that the TTE is only valid for Ross Hooks?

I've seen traders at TradingEducators use the TTE on 1-2-3s:

http://www.elitetrader.com/vb/showthread.php?s=&threadid=35916&perpage=10&pagenumber=1

Maybe they only used it on RHs before, as you stated that you may have an older version of the PDF, but they seem to use it on both RHs and 1-2-3s these days.

It's not my intention to start an argument on who's right or wrong, I'm only trying to figure out if there's something in the PDFs that I am missing :confused:
 
frugi said:
Barjon I'm pretty sure your definition of the hook is correct.
However I read the TTE like this (though I may be wrong :))
I have just seen this.

Frugi, does it not occur to you that entry at this point is not at greatest advantage ?

You would have had to wait for several bars to form before you could be assured that the move would progress higher, in line with your expectations.

And then, after waiting and twiddling of thumbs, the price progression is still not conclusive.
What I mean by this is that all closings thereafter are not on tops, but at middles.

The last bar, which folds over and collapses is to be expected.

This is not a strong market. It may well have been a strong market, but it is now evidently running out of steam.

This will become clear if you study the configuration of the bars and the price development to the top.
 
THE CHART ON POST NUMBER 63
#############################


While you are all busy looking at these hooks and things, you are misdirected from observing the obvious.

Look at bar 15 on this chart. It closes on the low at 10435. I don't even know what instrument it is because I haven't looked. See the volume. It is huge compared to the previous bars. The next bar also touches 10435 and then recoils. This is obviously serious buying to stop a fall dead in its tracks. In other words, this is deliberate and decisive accumulation.

There is no need to wait in this case. It goes from 10435 upwards and never retraces again to this level.

All of these things are obvious to me, if not to anyone else, so it is not necessary to overlabour the event because in doing so, well, the opportunity evaporates.....
 
SOCRATES said:
Look at bar 15 on this chart. It closes on the low at 10435. I don't even know what instrument it is because I haven't looked. See the volume. It is huge compared to the previous bars.

Socrates,

that first bar that bounce off the 10435 level is the first 10 minutes of NYSE trading (8:30). Of course it is huge, the bars before are pre-session (overnight) data.

Also, this is the Mini Dow with tick volume.

I get your point, two bars that bounce off the same level with overwhealming volume and long lower shadows (looking at them with candlestick eyes :D ) seems pretty attractive, but since they occurr at the beginning of the trading session I would have watched it unfold for a bit before I acted. the 1-2-3 would have been a good entry for me, although others may feel that those "hammers" on the first 20 minutes of trading would be sufficient.

Different perceptions of risk I guess.
 
Ah ! And in addition to the above, because I have looked at it again, the volume that follows is normal and the price progression is acceptable in conjunction with the volumetric impulse afforded it, therefore this rise is solid so far, and is likely to go on further.

I tell you these things because they are the result of my observations.

One should strive to make one's observations accurate, consistently accurate, and in good time.

That is what is required, followed by the ability to act upon these observations quickly, unerringly.
 
It is not a matter of risk, but a perception of opportunity. If you dither, and wait for confirmation, the opportunity that presents itself may not go away altogether, but remain, but with less advantage to the player, do you get my drift on this?

The risk element is a different argument altogether.

In fact the risk increases if you wait too long, because then the ingredient of advantage is impaired.
 
On the site with all the Joe Ross downloads:
http://www.trading-naked.com/Articles_and_Reprints.htm

If you go further down the page, to the part where the author said that he had not read the next section, you will find the download "123system"

This also covers information on the 1-2-3 formation, though it is not by Joe Ross, but by Mark Crisp.

Thought someone might be interested.
 
Yes, there are many variations of the 1-2-3 out there. I've read Mark Crisps PDF and I think also Trader Vic, Victor Sperandeo (if I wrote his surname correctly), writes about a 1-2-3 setup in one of his books.

But Joe Ross' explanation of the 1-2-3 highs and lows in The Law of Charts is one of the most specific descriptions I've encountered so far.

The 1-2-3 is certainly not a new setup in TA, but may have been rejected by many because of its simplicity.
 
This thread has gone a little quiet, so here is a teaser:

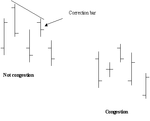
In TTRH, Joe Ross defines congestion as follows, in pages 59-60:

"Any time prices close on four bars, within the confines of the range of a single price bar and subsequent to that bar, you have congestion."

This is fine, nice and easy. But then he says:

"I have added to this a concept of my own. Any time prices open, close or both on four consecutive bars, both subsequent to and within the range of any preceding single measuring bar, you have congestion, provided that the bar having only the open inside the applicable range occurs before a correction is made."

Then there are two pictures, which I am trying to reproduce here. My question is what's the definition of a correction bar in congestion? In the first chart, why is the fourth bar a correction bar and not the second one?
 

Attachments

  • pic.GIF
    pic.GIF
    2.9 KB · Views: 699
Yes, it is simlpe really, only that the concept is not explained clearly.

The consequence of this, is that the writer knows full well what he means, but everyone else is left mystified by the statement, puzzled.

I hope that the manner in which I will now proceed to explain the riddle will clear it up for you.

So here goes :~

No sorry I have been interrrupted, bac later.
 
Continuation:~
##########


What he is saying and he is not saying very clearly is the following:~

If you look carefully at bar one in the first picture, this bar has an open, a close, a high and a low.
He is talking about a range. A range is the distance of total travel within a bar, meaning the distance between the highest high and the lowest low, which he calls "the confines of a bar". So far so good.

In the first picture, all the closes are within the range of the first bar, EXCEPT for the last one, that closes below the range, therefore according to his reasoning, the last bar is not contained within the congestion he describes.

In the second picture, all the closings on all the bars fall within the range of the first bar, therefore according to his reasoning, within the congestion that he describes, all the closings fall within it, so, as far as he is concerned, according to his reasoning, the second picture represents congestion that is intact.

And that is it.

I would not go about describing congestion in such a convoluted manner but there you have it, Horses for Courses. Simple.
 
Top