1-2-3-Formations and Ross Hooks

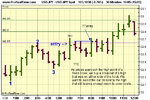
I'll catch up later.However in daytrading many of these hooks fail like this one just has on apple.
Many day traders know all these set ups written in the books,they know what all the rules for entry are and traders will anticipate the public coming in at these points and sell out to them.
 

Attachments

  • b3.gif
    b3.gif
    22.1 KB · Views: 1,108
  • b4.gif
    b4.gif
    25.1 KB · Views: 900
  • b5.gif
    b5.gif
    27.9 KB · Views: 902
barjon said:
Can you confirm or correct my impression that after a down move (creating 1) there is a rise (creating2) then a fall stopping short of 1 (creating 3) and that the ross hook comes after 2 is taken out and then a (or up to 3) failure bars. TTE is when the high of the last failure bar is taken out?
Yes; can confirm it.

barjon said:
Sorry if I'm being obtuse
Not at all; sorry that my "explanations" are not as clear as I imagine! I was posting this as a 1-2-3-trade, rather than a RH-trade, sorry for not making that clearer. You would in fact have had a better entry this time (as you have shown) by waiting for the hook, but of course one never knows when the next one will come along. :)
 
Naz said:
Many day traders know all these set ups written in the books,they know what all the rules for entry are and traders will anticipate the public coming in at these points and sell out to them.
Indeed. Ross suggests (among other things) that one of the ways to try to avoid this is by using slightly different charts from the rest of the world. Specifically, he suggests trading from 9-minute charts rather than 10-minute charts for faster-moving intraday trades. Not (I think) in an attempt to be faster-moving, but mostly in an attempt to be getting in and out at different times from other traders.
 
Hi Naz,

I know what you are saying but if you had traded that chart as Joe ross suggests which is scaling out of a trade using 2 or 3 lots, with a trailing stop, that trade would have been profitable (not hugely, granted). However, there are also a number of hooks on the way down which also would have been profitable. The chart you showed was still heading south for potentially very profitable trade. (dont know what happenned after on your chart).
 
TTE is when the high of the last failure bar is taken out?

I think I must be the one who is being obtuse but I can't see this in the book anywhere. Can anyone point me to the page # please? :confused:
 
My view is that if you have a set up that is in lots of books and the public domain,the public will trade it and stick to the rules. I can look at an intra day chart at times and say oh yes that's where the public will enter, because thats one of those such and such set ups.As a day trader isn't better to be in before them and let their late entries boost your profit and if it wobbles sell out.

If it runs then you've got a great trade if it has a problem you can get out flat or with something small.

To me it makes sense to anticipate moves not take positions where the majority will enter, because in many cases who else is left to come in,invariably no one and we sell off.
 
Roberto said:
Just posting another 1-2-3-trade chart while it's to hand.

USD/JPY. 2-point was at 102.64. Entry at 102.65 on 6.00 bar. Took profit of 15 pips on one third of the position at 102.80 on the 10.00 bar, and moved the stop-loss on the remaining two-thirds to break-even. Took profit of 30 pips at 102.95 on the next third of the position, and moved the stop-loss on the remaining third to 102.80 on the 11.30 bar, intending optimistically to let the last third run with a trailing stop. Sadly got stopped out on the last third as usual (but still with 15 pips profit on it) on the following bar. Average of +20 pips. (Original stop-loss apparently not shown on this chart, sorry).

Good result. Was your initial stop at point"1"?
Were you not tempted to raise this a bit or scratch the trade as the price went nowhere between 6:00 and 10:00?
(Or perhaps that's just my psychological deficiencies coming to the surface!)
 
JumpOff said:
were you looking at:

  1. price action only
  2. level II orders
  3. recorded volume
  4. a longer term chart that showed support there
  5. something not mentioned in this list
  6. some kind of combination of these?
JO

Hi Jo,

I trade the Dow with a tracking stock called the Damonds,code DIA mainly because there is little or no spread.As its a stock, it comes with a level 2 screen with all the players showing their quotes.Read it like you would other stocks and you've got a terrific way of playing the Dow.In trading you need every edge you can get.

Naz
 
darrenf said:
I sometimes take an entry off the bar that "confirms" point 3 of the 123. It's a more aggressive entry but on the chart, the confirmation bar would be the 5 am bar, the one after that marked as point 3 on the usd/jpy chart. I call it a confirmation bar as it has made a higher low and higher high than the point 3 bar. As I say, this is a more aggressive entry and the first target would be point 2 of the 123 formation. This is a kind of traders trick entry which I currently use with a 3 lot position. 1st scale out being point 2.

Darren

Where would you decide if you were wrong - just below "3"?
 
Barjon I'm pretty sure your definition of the hook is correct.
However I read the TTE like this (though I may be wrong :))
 

Attachments

  • untitled.jpg
    untitled.jpg
    224.7 KB · Views: 2,102
Excellent thread. Many thanks Roberto.

I did a quick scan just to see if anyone has brought up the subject of defining the current trend. I found Joe Ross' defintion of the trend a little difficult to follow.

Could someone, who has understood this, write a few line about it? Thanks.
 
pratbh said:
Excellent thread. Many thanks Roberto.

I did a quick scan just to see if anyone has brought up the subject of defining the current trend. I found Joe Ross' defintion of the trend a little difficult to follow.

Could someone, who has understood this, write a few line about it? Thanks.

From what I've read Ross states that a 1-2-3 (breakout of 2) defines the trend and the Ross Hook (breakout of RH) establishes the trend.

A trend is recognised by higher highs and higher lows / lower highs and lower lows.

Using this definition of a trend the 1-2-3 creates the first higher low and the ross hook the first higher high in a bullish trend, and the opposite for the bearish trend.

Don't know if it was this you were wondering about. I'm only half way thorugh "Trading by the Book" so I'm by far no expert on Ross' methods, but this is the way I have understood his definition of the beginning of a trend.

Skog
 
Last edited:
I have started with TTRH, in which Joe Ross defines trend in pages 51-52. It's a bit difficult to quote, because there are illustrations as well...

I will probably have to read those pages many more times. Joe Ross' work is not the easiest to follow and requires time, I am told.

Has anyone found a clear definition of reverse RH? In TTRH, a picture of the RRH is given in page 42, but it's not defined anywhere...
 
pratbh said:
Has anyone found a clear definition of reverse RH? In TTRH, a picture of the RRH is given in page 42, but it's not defined anywhere...

A RRH is the #2 in a 1-2-3.

The Ross Hook is actually a 1-2 (if I can use this comparison), and the #1 is called a RH, but if prices never reach this RH (#1) but turns and moves below the #2 we have a 1-2-3.

So a breach of the #2 in the 1-2-3 is actually a breach of a Reverse Ross Hook.

Skog
 
Darren

Where would you decide if you were wrong - just below "3"?

Yes, usually one point below "3" as this invalidates the reversal pattern. Using the more agressive entry usually keeps the stop smaller too.
 
Less action in this thread today so I thought I'd post an image of the current price movement in the mini dow.

attachment.php


This is a nice 1-2-3 on the 10 minute chart (Andy Jordan, a trader at TradingEducators uses this timeframe frequently).

By applying the TTE an entry would have been placed at 10456 (the green line) around 9:30 (Chicago Time) and by placing a stop right below the #3 (the lower red line) we risk 16 points.

Maybe Joe Ross would have managed this trade another way, but by placing a target at 10488 we get a Reward:Risk of 2:1. I would just once again like to mention that I don't know if Ross would have managed this trade this way.

So, a nice 1-2-3 low that acted just like Ross says in his books ;)

As I'm writing this post I also see that the last bar on the chart I've uploaded actually was the first RH in this uptrend, but it hasn't yet been broken.

Skog

(P.S If anybody was wondering, I didn't trade this setup. Just watched it eagerly :cheesy: )
 

Attachments

  • 123 10min Dow.gif
    123 10min Dow.gif
    17.4 KB · Views: 4,949
A formation is not a 123 formation if it hasn't got a point 3, am I right?

So in the first chart attached, the low is not a 123 low, or is it?

The next question is how long do we wait for a 123 formation to take shape (second chart) ?
 

Attachments

  • pic.GIF
    pic.GIF
    1.7 KB · Views: 397
  • pic.GIF
    pic.GIF
    2.2 KB · Views: 513
Last edited:
Top