Many traders do not use volume in their market analysis and trading. They rely on price bar patterns and technical indicators. Price alone can be misleading and technical indicators frequently signal miss-fires. Understanding the interaction of price and volume can help put the trader on the right side of the market regardless of the trading method used. Here is a recent example of how the S&P e-mini market unfolded. Reading the interaction of price and volume led to both intraday and swing trades.
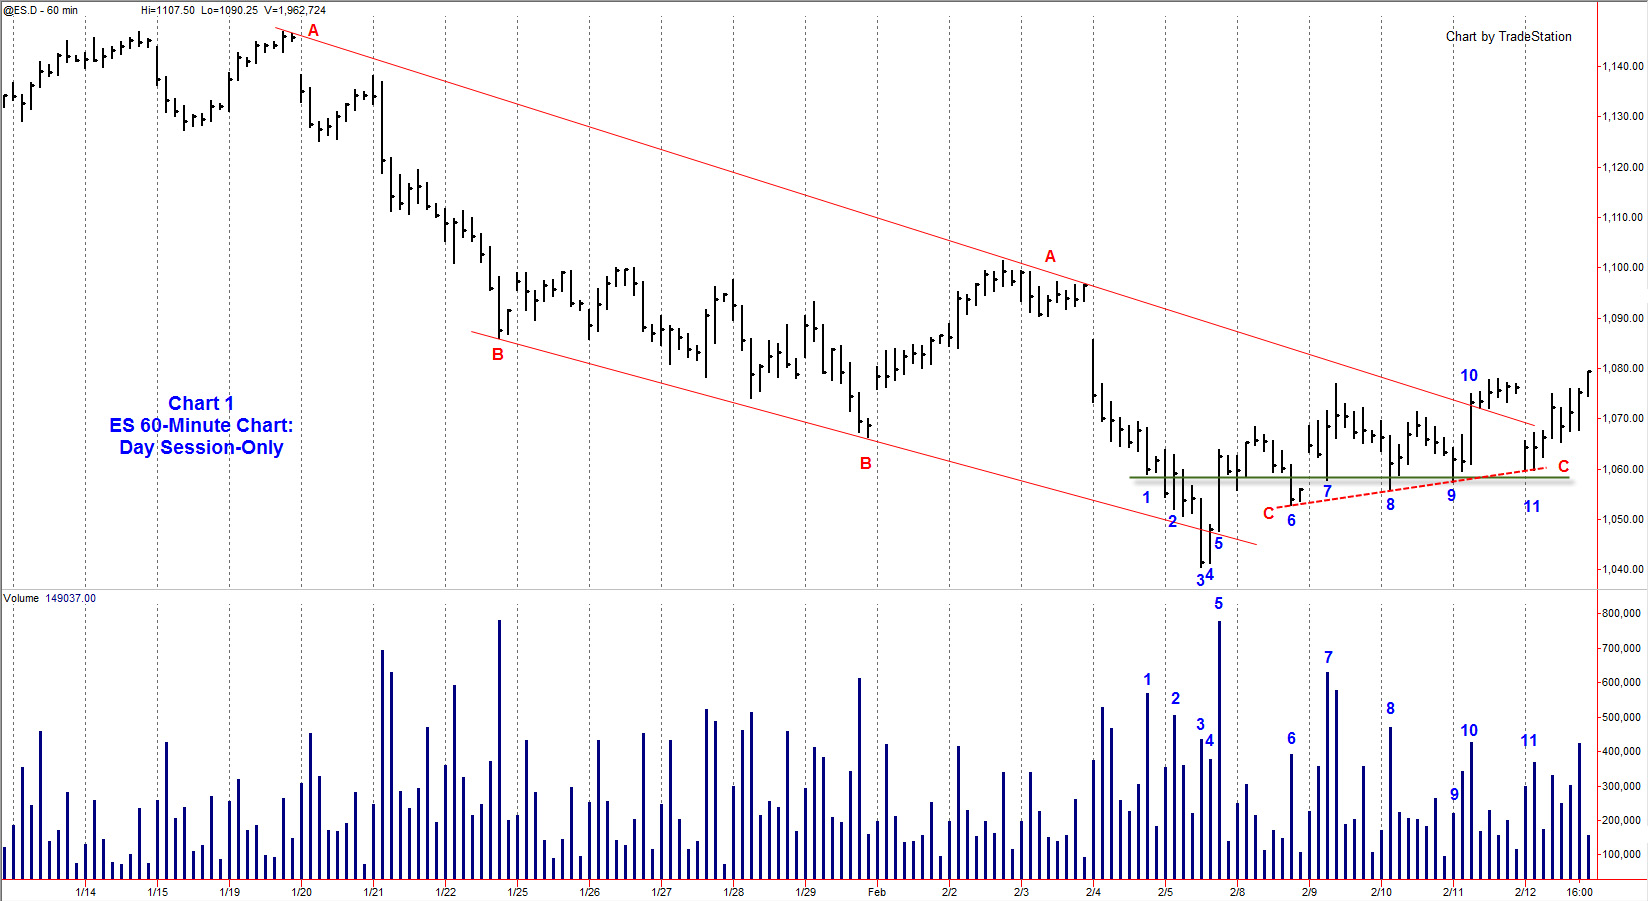
The S&P e-mini market had reacted into early February from its highs in January 2010. The reaction was well-defined on the hourly chart (Chart 1) by the trend lines AA and BB, which together formed a channel. Line AA was drawn off the obvious rally peaks and Line BB from the low points.
At point 3 on Chart 1 (February 5th), the market became potentially oversold by its position in the trend channel. When a trend has respected its trend lines as here, a penetration of the lower trend line typically indicates an oversold market. Subsequent market action proved this correct, and the market rallied vigorously.
How to Read Intraday Volume
On a typical market day in the S&P e-minis, volume is heaviest in the first 90 minutes of the day and again in the last 60-90 minutes. Volume is usually light in between these periods, with the lightest volume occurring during the noon hour period (New York Time). A typical day in volume will often look U-shaped.
It was notable, therefore, when volume expanded on bars 3, 4 and 5. It signified that market behavior had changed. Bars 4 and 5 reflected a significant rally on sustained, high volume - something we had not seen before in this downdraft. In fact, Bar 5 is the largest up bar on the largest volume since the downtrend had begun. This is usually significant and a useful "market tell" that no indicator will register. In this case, the market rejected lower, oversold prices and then rallies strongly - bullish behavior.
The next day (February 8th), the market falls back down on Bar 6 reaching a low of 1053. At this point, it is unclear whether the market will fall lower the next day. Although price did not fall hard after breaking the early morning low on this day, sellers did close the day on its lows and volume expanded on Bar 6, indicating supply remained present.
Daily Highs & Lows
On February 9th, we have a small gap opening and a brief rally into yesterday's high. In trading the S&Ps, yesterday's high and low are often key reference levels of support or resistance. Take a good look at any daily chart of the S&P e-minis and you will see that there is a lot of trading around the previous day's high or low. Good day trades often set up around these levels. After testing yesterday's high, the market fell back about 10 points towards yesterday's low.
That low did not get breached, however. Buyers came in strongly and drove the market back up to a new high on the day. This is Bar 7. Note the strong close, wide range, and the high volume. Demand came into the market.
Accumulation
The next day (February 10th), the market drops lower at Bar 8, but once again, we see buying come in at about the same level as on Bar 6 and Bar 7. The low at Bar 6 was 1053.00. The low at Bar 7 was 1058.00. Bar 8 dipped down to a low of 1056.25 before buying came in. Note that the close of this bar is in the middle, and then rallies. The volume is high.
The next morning (February 12th) opens and the market drops back into the same zone where buyers were present at Bars 6, 7, and 8. Here on Bar 9, volume was comparatively light on the dip into the buying zone. The market then rallies strongly and breaks the Trend Line AA for the first time.
We can now take a closer look at the market from the perspective of price and volume and begin to make some useful conclusions. We can go back in time a bit and see that high volume came in on Bar 1 and Bar 2 at the same level of buying that we have seen since the lows at Bar 3 had been put in. I have highlighted the level with a green line. It is likely that buying - partially under the cover of the drive down to the February 5th lows - had been occurring as early as February 4th and continued through the following week.
We can also see that the lows had been lifting along the red dashed Line CC. This indicates that buyers were becoming more eager and more aggressive in their buying (and supply was progressively decreasing) as the trading range progressed. On the last day of the hourly chart, the market gapped back below Line AA, but held the rising Line CC and rallied back out of the down trend channel, closing on its high and decisively breaking the back of the downtrend.
Value of Price & Volume - Swing Trade
It is worthwhile to note that many traders writing blogs and making YouTube commentaries were calling for "a new leg down" as price was approaching their downtrend lines. Those traders who can read price and volume action would at least be skeptical of these calls. In developing these skills, traders place themselves in a position of being able to read the market by its own action, without having to rely on others or on frequently bewildering indicators.
The implications for a swing trader are obvious. There was evidence of sufficient buying for a good swing trade. This was accumulation in action. Once traders with enough wherewithal have stepped into the market and repeatedly bought over several days like this, the odds favor that "a new leg up" is in the immediate future.
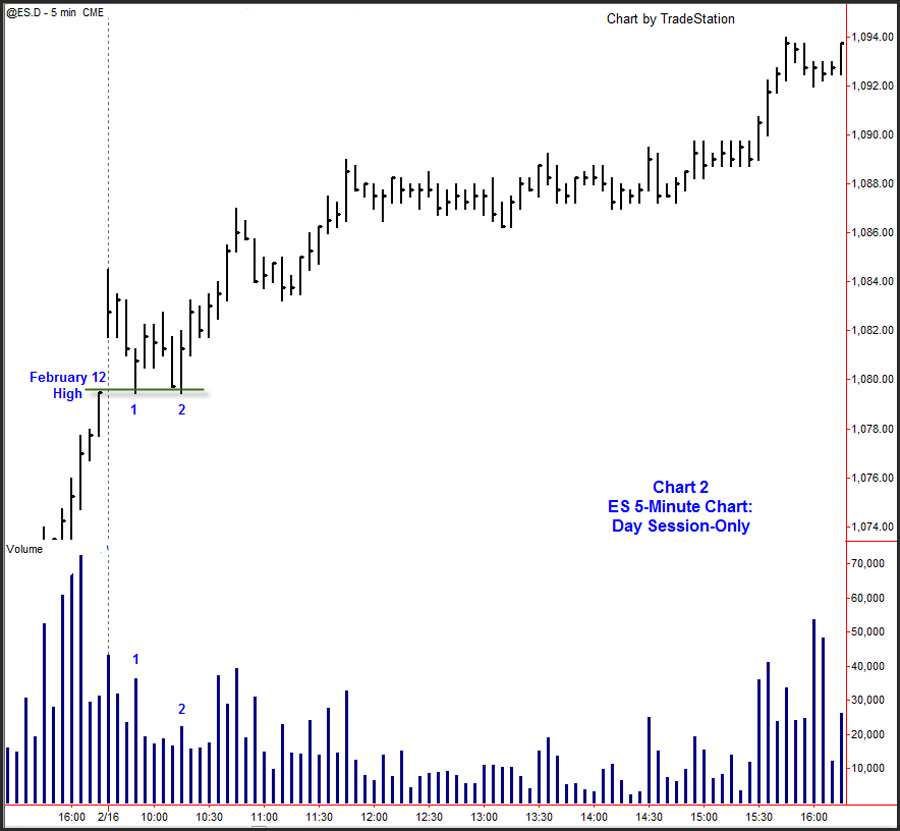
Day traders can also take advantage of this situation. On February 12th (Friday), the market pushed above the downtrend channel and closed the day on its high (1079.25). After the long, holiday weekend (President's Day in the US), the market gapped open, but quickly fell off. On the 5-minute chart, we see buyers step in as the market comes down to and tests the previous day's high. On bar 1, there is an increase in volume and a strong close on the 5-minute bar. Traders who had been assessing the market the previous week would be primed to step in and buy at this point. On Bar 2, the market offered a second opportunity for a long position. Here the volume receded as price came back down to yesterday's high signifying that selling was non-existent. This touched off a trend day to the upside where the market rallied throughout the day and closed on its high. It also ignited a multiday rally that rewarded the swing trader.
Learning to read the market by its own action is a skill. Like any skill, it takes dedicated practice to develop.
More details can be found at Trading Psychology Edge
Background: 60-Minute Chart
The S&P e-mini market had reacted into early February from its highs in January 2010. The reaction was well-defined on the hourly chart (Chart 1) by the trend lines AA and BB, which together formed a channel. Line AA was drawn off the obvious rally peaks and Line BB from the low points.
At point 3 on Chart 1 (February 5th), the market became potentially oversold by its position in the trend channel. When a trend has respected its trend lines as here, a penetration of the lower trend line typically indicates an oversold market. Subsequent market action proved this correct, and the market rallied vigorously.
How to Read Intraday Volume
On a typical market day in the S&P e-minis, volume is heaviest in the first 90 minutes of the day and again in the last 60-90 minutes. Volume is usually light in between these periods, with the lightest volume occurring during the noon hour period (New York Time). A typical day in volume will often look U-shaped.
It was notable, therefore, when volume expanded on bars 3, 4 and 5. It signified that market behavior had changed. Bars 4 and 5 reflected a significant rally on sustained, high volume - something we had not seen before in this downdraft. In fact, Bar 5 is the largest up bar on the largest volume since the downtrend had begun. This is usually significant and a useful "market tell" that no indicator will register. In this case, the market rejected lower, oversold prices and then rallies strongly - bullish behavior.
The next day (February 8th), the market falls back down on Bar 6 reaching a low of 1053. At this point, it is unclear whether the market will fall lower the next day. Although price did not fall hard after breaking the early morning low on this day, sellers did close the day on its lows and volume expanded on Bar 6, indicating supply remained present.
Daily Highs & Lows
On February 9th, we have a small gap opening and a brief rally into yesterday's high. In trading the S&Ps, yesterday's high and low are often key reference levels of support or resistance. Take a good look at any daily chart of the S&P e-minis and you will see that there is a lot of trading around the previous day's high or low. Good day trades often set up around these levels. After testing yesterday's high, the market fell back about 10 points towards yesterday's low.
That low did not get breached, however. Buyers came in strongly and drove the market back up to a new high on the day. This is Bar 7. Note the strong close, wide range, and the high volume. Demand came into the market.
Accumulation
The next day (February 10th), the market drops lower at Bar 8, but once again, we see buying come in at about the same level as on Bar 6 and Bar 7. The low at Bar 6 was 1053.00. The low at Bar 7 was 1058.00. Bar 8 dipped down to a low of 1056.25 before buying came in. Note that the close of this bar is in the middle, and then rallies. The volume is high.
The next morning (February 12th) opens and the market drops back into the same zone where buyers were present at Bars 6, 7, and 8. Here on Bar 9, volume was comparatively light on the dip into the buying zone. The market then rallies strongly and breaks the Trend Line AA for the first time.
We can now take a closer look at the market from the perspective of price and volume and begin to make some useful conclusions. We can go back in time a bit and see that high volume came in on Bar 1 and Bar 2 at the same level of buying that we have seen since the lows at Bar 3 had been put in. I have highlighted the level with a green line. It is likely that buying - partially under the cover of the drive down to the February 5th lows - had been occurring as early as February 4th and continued through the following week.
We can also see that the lows had been lifting along the red dashed Line CC. This indicates that buyers were becoming more eager and more aggressive in their buying (and supply was progressively decreasing) as the trading range progressed. On the last day of the hourly chart, the market gapped back below Line AA, but held the rising Line CC and rallied back out of the down trend channel, closing on its high and decisively breaking the back of the downtrend.
Value of Price & Volume - Swing Trade
It is worthwhile to note that many traders writing blogs and making YouTube commentaries were calling for "a new leg down" as price was approaching their downtrend lines. Those traders who can read price and volume action would at least be skeptical of these calls. In developing these skills, traders place themselves in a position of being able to read the market by its own action, without having to rely on others or on frequently bewildering indicators.
The implications for a swing trader are obvious. There was evidence of sufficient buying for a good swing trade. This was accumulation in action. Once traders with enough wherewithal have stepped into the market and repeatedly bought over several days like this, the odds favor that "a new leg up" is in the immediate future.
A Day Trade
Day traders can also take advantage of this situation. On February 12th (Friday), the market pushed above the downtrend channel and closed the day on its high (1079.25). After the long, holiday weekend (President's Day in the US), the market gapped open, but quickly fell off. On the 5-minute chart, we see buyers step in as the market comes down to and tests the previous day's high. On bar 1, there is an increase in volume and a strong close on the 5-minute bar. Traders who had been assessing the market the previous week would be primed to step in and buy at this point. On Bar 2, the market offered a second opportunity for a long position. Here the volume receded as price came back down to yesterday's high signifying that selling was non-existent. This touched off a trend day to the upside where the market rallied throughout the day and closed on its high. It also ignited a multiday rally that rewarded the swing trader.
Learning to read the market by its own action is a skill. Like any skill, it takes dedicated practice to develop.
More details can be found at Trading Psychology Edge
Last edited by a moderator: