Over the last few months I've discussed a lot of the basics of trading options. It's like building a house; you start with the foundation. As far as actually trading, I've discussed Puts and Calls and a little bit about Covered Calls. Now we're going to start thinking about different types of spread strategies. Why do we want to spread? Several reasons; it reduces the overall cost and limits the risk of a position. At the same time it lowers the breakeven point for the position and allows flexibility to take advantage of different types of market conditions. Of course, like everything else in trading, there is a trade-off. The maximum potential on the upside may be capped, and there will be more commission costs and more bid/ask spreads to contend with.
Today we're going to examine some characteristics of a very popular option trading strategy known as a Straddle. First we need to know exactly what a Straddle is.
Definition: A long (short) Straddle is the purchase (sale) of a Put and a Call on the same underlying stock with the same strike price and time to expiration.
Just as a point of information; some traders don't consider a Straddle to be a spread. They define a spread to be a position that consists of both long and short options. For our purposes, a spread will be any position that has both long and short deltas.
An example of a long Straddle would be the purchase of the XYZ July 50 Call and the July 50 Put. If the Call is trading for $2, the Put for $1.75 and we bought 10 Straddles, the total cost (excluding commissions) would be $3,750. Of course, if we sold the Straddles, we would receive a credit of $3,750 coming into our account. Long Straddles must be paid for in full, they cannot be bought on margin and short Straddles have margin requirements (that will be the subject of a future article.).
The following graphs show the profit and loss for both a long and short Straddle at expiration. Notice, that as you would expect, they are mirror images of each other. If one side makes money, the other side loses the same amount. Remember folks, it's a zero sum game.
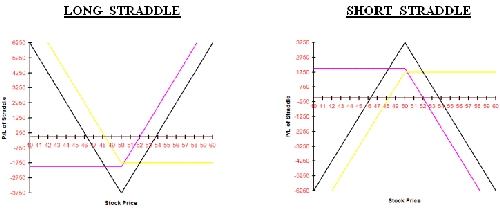
Notes: The black lines represent the Straddle positions. The purple and yellow lines represent the expiration graphs of the Call and Put, respectively.
Okay, so when do we reach into our bag of options strategies and pull out the Straddle? It's when we expect the stock to make a large move, but we're not sure in which direction the movement will take place. This can happen when an event is expected, such as earnings, a verdict in a court case, an FDA announcement, etc. There can also be unexpected events, such as a takeover, merger, announcement of a new product, or the replacement of a key officer of the company, etc., that will cause the stock to make a large move.
Let's examine the characteristics of this spread in terms of the Greeks that we spent so much time learning about. I'll talk about the long Straddle, but you know that the short side will be just the opposite.
DELTA and GAMMA - Assuming that the Straddle was put on with the stock price close to the strike price, the delta will be close to 0, approximately +50 for the Call and -50 for the Put. That means that the position doesn't have a bias to either the upside or the downside. However, since the position is long the Call and the Put, and since both Calls and Puts have positive Gamma, the Straddle is very long Gamma. This means that as the stock starts moving away from the strike, it will get shorter on the downside and longer on the upside. That's exactly what we want!
We want the stock to move as far as possible from the strike price. In fact, we can see from the graph that the worst place that the stock could be at expiration would be at $50. In that case the Straddle would be worth 0, and we would lose the entire investment of $3,750. In reality, we would have either exited the position prior to expiration or made adjustments along the way, and most probably would not have lost the entire amount. That process will be discussed in a future article.
It's also always useful to know the breakeven points on the upside and downside. Fortunately, in the case of a Straddle it's easy to calculate. Simply add the premium to the strike price to get the upside breakeven of $50 + 3.75 = $53.75, and subtract the premium from the strike price to get the downside breakeven of $50 - 3.75 = $ 46.25.
VEGA - Again, since the position is long options and long options have positive vega, this position is very sensitive to changes in volatility. So in addition to price movement, we are hoping for an increase in volatility. Well, that implies that we would put this position on in a low volatility environment. Isn't that a contradiction? We want low volatility, but large movement in the stock! Yes and no; at expiration the volatility doesn't matter anymore. The stock price will be whatever it is, and that will determine the amount of profit or loss for the position. Prior to expiration, the volatility can have a great impact on the value of the Straddle. It is possible that with only a small movement in the stock, but with a significant increase in implied volatility, that the Straddle could still be profitable prior to expiration. Sometimes we can have our cake and eat it too!
THETA - Again, we're still dealing with only long options, and long options have negative theta, so the position is losing value every day. Making matters worse, the rate of loss is constantly accelerating. So what can we do to mitigate this situation? We generally don't buy near term Straddles. A rule of thumb is that Straddle buys should be 3 months or more to expiration. I said "generally" for a reason. There are some situations where it does make sense to buy near term Straddles, and in fact, one of my favorite types of trades has to do with buying Straddles on the day of, or day before, expiration. You'll have to keep reading these articles to learn about that one!
Why have I focused only on the long Straddle? Take another look at the graph. Notice how it can have unlimited losses on both the upside and the downside. It's unfortunate, because there are times when you might want to sell the Straddle but are afraid to assume the risk of a large price movement. Well fear not, there are ways to control the risk, but that leads to another type of position (it's called a Butterfly) on another day.
While you're digesting the above, I'm going to give you a bonus. It's something that most traders, including professionals, don't know. In fact, it's something I normally only share with my mentoring students. It's a formula, and here it is:
ATM Straddle premium = .8 x S x V x SQRT(T)
Where,
S = Stock or strike price (they are the same since it's At-The-Money)
V = Volatility, and
T = Time to expiration in years
In the example above, S = $50, V =.23, and T = 60 days or .1644 years. Plugging into the formula yields: .8 x 50 x .23 x SQRT(.1644) = $3.73 versus the actual premium of $3.75. Not too bad!
Today we're going to examine some characteristics of a very popular option trading strategy known as a Straddle. First we need to know exactly what a Straddle is.
Definition: A long (short) Straddle is the purchase (sale) of a Put and a Call on the same underlying stock with the same strike price and time to expiration.
Just as a point of information; some traders don't consider a Straddle to be a spread. They define a spread to be a position that consists of both long and short options. For our purposes, a spread will be any position that has both long and short deltas.
An example of a long Straddle would be the purchase of the XYZ July 50 Call and the July 50 Put. If the Call is trading for $2, the Put for $1.75 and we bought 10 Straddles, the total cost (excluding commissions) would be $3,750. Of course, if we sold the Straddles, we would receive a credit of $3,750 coming into our account. Long Straddles must be paid for in full, they cannot be bought on margin and short Straddles have margin requirements (that will be the subject of a future article.).
The following graphs show the profit and loss for both a long and short Straddle at expiration. Notice, that as you would expect, they are mirror images of each other. If one side makes money, the other side loses the same amount. Remember folks, it's a zero sum game.
Notes: The black lines represent the Straddle positions. The purple and yellow lines represent the expiration graphs of the Call and Put, respectively.
Okay, so when do we reach into our bag of options strategies and pull out the Straddle? It's when we expect the stock to make a large move, but we're not sure in which direction the movement will take place. This can happen when an event is expected, such as earnings, a verdict in a court case, an FDA announcement, etc. There can also be unexpected events, such as a takeover, merger, announcement of a new product, or the replacement of a key officer of the company, etc., that will cause the stock to make a large move.
Let's examine the characteristics of this spread in terms of the Greeks that we spent so much time learning about. I'll talk about the long Straddle, but you know that the short side will be just the opposite.
DELTA and GAMMA - Assuming that the Straddle was put on with the stock price close to the strike price, the delta will be close to 0, approximately +50 for the Call and -50 for the Put. That means that the position doesn't have a bias to either the upside or the downside. However, since the position is long the Call and the Put, and since both Calls and Puts have positive Gamma, the Straddle is very long Gamma. This means that as the stock starts moving away from the strike, it will get shorter on the downside and longer on the upside. That's exactly what we want!
We want the stock to move as far as possible from the strike price. In fact, we can see from the graph that the worst place that the stock could be at expiration would be at $50. In that case the Straddle would be worth 0, and we would lose the entire investment of $3,750. In reality, we would have either exited the position prior to expiration or made adjustments along the way, and most probably would not have lost the entire amount. That process will be discussed in a future article.
It's also always useful to know the breakeven points on the upside and downside. Fortunately, in the case of a Straddle it's easy to calculate. Simply add the premium to the strike price to get the upside breakeven of $50 + 3.75 = $53.75, and subtract the premium from the strike price to get the downside breakeven of $50 - 3.75 = $ 46.25.
VEGA - Again, since the position is long options and long options have positive vega, this position is very sensitive to changes in volatility. So in addition to price movement, we are hoping for an increase in volatility. Well, that implies that we would put this position on in a low volatility environment. Isn't that a contradiction? We want low volatility, but large movement in the stock! Yes and no; at expiration the volatility doesn't matter anymore. The stock price will be whatever it is, and that will determine the amount of profit or loss for the position. Prior to expiration, the volatility can have a great impact on the value of the Straddle. It is possible that with only a small movement in the stock, but with a significant increase in implied volatility, that the Straddle could still be profitable prior to expiration. Sometimes we can have our cake and eat it too!
THETA - Again, we're still dealing with only long options, and long options have negative theta, so the position is losing value every day. Making matters worse, the rate of loss is constantly accelerating. So what can we do to mitigate this situation? We generally don't buy near term Straddles. A rule of thumb is that Straddle buys should be 3 months or more to expiration. I said "generally" for a reason. There are some situations where it does make sense to buy near term Straddles, and in fact, one of my favorite types of trades has to do with buying Straddles on the day of, or day before, expiration. You'll have to keep reading these articles to learn about that one!
Why have I focused only on the long Straddle? Take another look at the graph. Notice how it can have unlimited losses on both the upside and the downside. It's unfortunate, because there are times when you might want to sell the Straddle but are afraid to assume the risk of a large price movement. Well fear not, there are ways to control the risk, but that leads to another type of position (it's called a Butterfly) on another day.
While you're digesting the above, I'm going to give you a bonus. It's something that most traders, including professionals, don't know. In fact, it's something I normally only share with my mentoring students. It's a formula, and here it is:
ATM Straddle premium = .8 x S x V x SQRT(T)
Where,
S = Stock or strike price (they are the same since it's At-The-Money)
V = Volatility, and
T = Time to expiration in years
In the example above, S = $50, V =.23, and T = 60 days or .1644 years. Plugging into the formula yields: .8 x 50 x .23 x SQRT(.1644) = $3.73 versus the actual premium of $3.75. Not too bad!
Last edited by a moderator: