Are you like many investors who go to sleep each night feeling safe and secure because their investment portfolios are properly diversified? Conventional diversification attempts to decrease risk and offer more opportunity for the average investor. However, when we observe conventional diversification protocol through the objective eyes of pure supply and demand, it becomes quite clear that conventional diversification actually increases risk and decreases opportunity.
The Foundation: Quantify Supply and Demand
As I have repeated so many times, the movement of price in any and all free markets is a function of the laws of pure supply and demand. Low risk/high reward buying and selling opportunity emerges when this simple and straight forward relationship is out of balance. Let's review the chart below to refresh how and why we quantify supply and demand as this will lead us to our objective opportunities for low risk gains and how to properly diversify.
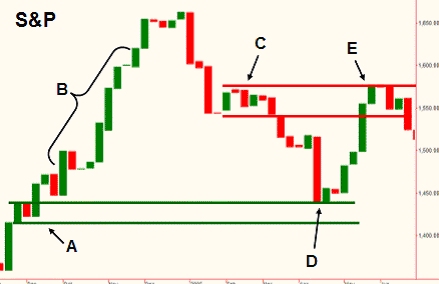
This is a weekly chart of the S&P 500. Notice price level "A". For a period of time, price was stable, suggesting supply and demand is in balance (equilibrium) at that level. Once price moves higher "B", it is clear that there was no equilibrium at "A". In fact, we can now say that price level "A" represents a major supply and demand imbalance. We know this to be true because the only reason price moves higher from "A" is because there were many more willing buyers than sellers at "A", and it simply took time for this unbalanced equation to play out. You don't need a technical indicator or some professional to tell you this, it's simple logic. "D" represents the first decline in price to the objective demand level which is where we find our lowest risk/highest reward buying opportunity. For diversification purposes, this would be the ideal time to buy into the S&P 500.
"C" is just the opposite. It is a price level where objectively, supply exceeds demand. For a period of time, price was stable at level "C", and then there was a sharp decline. The decline tells us that there is much more supply than demand at "C". "E" represents the first time price revisits the objective supply level which is where we want to sell or sell short.
The Simplicity of Markets
Put quite simply, a trading and investing market is made up of three components: buyers, sellers, and a widget being bought or sold. These widgets may be shares of a stock, S&P futures, foreign currencies, bonds, and many more tangible and intangible "widgets". For example, let's say the widget is a stock. This stock has some value. That value or "price" as we call it is determined simply by the supply and demand for the stock, which is the ongoing interaction of all the buyers and sellers taking action with regard to that particular stock.
A market is always in one of three states:
The greater the supply and demand imbalance, the greater the opportunity
This is true when buying and selling anything, not just with your investments. While many "professionals" would have you diversify your portfolio by buying many different stocks or a "ladder" of bonds for example, a much more efficient, lower risk/higher reward approach is to identify the markets with the greatest supply/demand imbalance and risk your hard earned capital there. This is not all that different from stretching a rubber band. The more you stretch it, the more potential energy is stored, waiting until it reaches a threshold where that energy is released and it snaps back. The thresholds in markets where prices turn are the price levels where supply and demand are out of balance, period.
Seeing the supply/demand curve on a price chart
How do we know when we are at these levels, far from equilibrium? Please revert back to the first chart in this piece. Price levels "A" and "C" represent the boundaries of this curve. All you have to do is look at a larger time frame chart (or smaller if you're an active trader) and do the following:
The Problems with Conventional Portfolio Diversification
For most investors, your portfolio is split between stocks and bonds. Whatever the split is, have you ever realized that almost every investment in a typical portfolio appreciates only when prices go up? What happens if these markets go down for a significant period like they did in Japan for over 10 years? And worse, what happens if this decline in price begins when you are near retirement?
When we break down portfolio diversification in stocks, there is another issue to be aware of. Your average investor will typically be told to reduce risk by investing portions of their portfolio in different stock sectors and markets. An example would be to have a portion of your stock portfolio in Dow stocks which are typically large cap stocks and a portion in the tech heavy NASDAQ market.
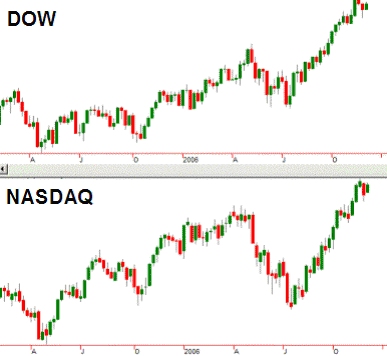
At first glance, these two charts appear to be the same chart. During almost any period in time, equity markets move in the same general direction. As you can see here, diversifying in these two markets is really not decreasing risk, it is actually increasing risk. The average investor thinks their hard earned capital is diversified properly between two semi-uncorrelated markets but the truth is, the risk is actually DOUBLED as these markets almost always move in the same direction. Again, conventional diversification is typically risk-disguised as opportunity for the ill-informed investor. These days, it is also very uncommon for a foreign equity market to move in the opposite direction of the major U.S. markets for any sustained period of time.
Proper Diversification According to the Laws of Supply and Demand
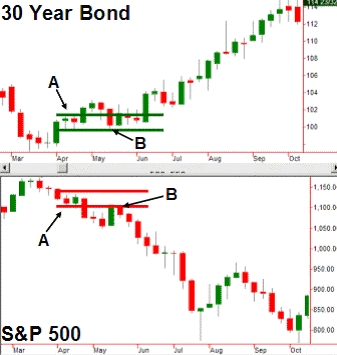
Ok, enough questions and alarming issues. Let's use pure supply and demand and learn how to properly diversify your portfolio. Notice the charts above. Here, we are looking at the same period of time in the S&P 500 and the 30 Year Bond. Area "A" in the S&P chart represents a major supply level for reasons mentioned prior in this piece. "B" is the first time price revisits that area of imbalance which is where we would want to sell for profits or initiate a short position. Let's take a look at the 30 Year Bond chart. Area "A" represents a major demand level, again, for reasons discussed earlier in this piece. "B" represents the low risk/high reward time to buy into the Bond market.
Take action when risk is lowest and reward is highest
As you can see, at the exact same period of time, the S&P begins its huge decline and the Bonds begin their enormous rise. The proper play for the astute diversifier is to take profits (sell) on much if not all of your stock holdings and buy into the bond market. This is how we diversify our portfolio based on the laws of supply and demand.
No matter how diverse your stock holdings were during that decline in the S&P, you likely lost plenty of your investment capital. Had you listened to the whispers of Adam Smith and focused on pure supply and demand, the move from stocks to bonds was very clear. Don't let the illusions of conventional thought obscure what is truly a simple reality that anyone can understand and apply.
The Foundation: Quantify Supply and Demand
As I have repeated so many times, the movement of price in any and all free markets is a function of the laws of pure supply and demand. Low risk/high reward buying and selling opportunity emerges when this simple and straight forward relationship is out of balance. Let's review the chart below to refresh how and why we quantify supply and demand as this will lead us to our objective opportunities for low risk gains and how to properly diversify.
This is a weekly chart of the S&P 500. Notice price level "A". For a period of time, price was stable, suggesting supply and demand is in balance (equilibrium) at that level. Once price moves higher "B", it is clear that there was no equilibrium at "A". In fact, we can now say that price level "A" represents a major supply and demand imbalance. We know this to be true because the only reason price moves higher from "A" is because there were many more willing buyers than sellers at "A", and it simply took time for this unbalanced equation to play out. You don't need a technical indicator or some professional to tell you this, it's simple logic. "D" represents the first decline in price to the objective demand level which is where we find our lowest risk/highest reward buying opportunity. For diversification purposes, this would be the ideal time to buy into the S&P 500.
"C" is just the opposite. It is a price level where objectively, supply exceeds demand. For a period of time, price was stable at level "C", and then there was a sharp decline. The decline tells us that there is much more supply than demand at "C". "E" represents the first time price revisits the objective supply level which is where we want to sell or sell short.
The Simplicity of Markets
Put quite simply, a trading and investing market is made up of three components: buyers, sellers, and a widget being bought or sold. These widgets may be shares of a stock, S&P futures, foreign currencies, bonds, and many more tangible and intangible "widgets". For example, let's say the widget is a stock. This stock has some value. That value or "price" as we call it is determined simply by the supply and demand for the stock, which is the ongoing interaction of all the buyers and sellers taking action with regard to that particular stock.
A market is always in one of three states:
- First, it can be in a state where demand exceeds supply which means there is competition to buy and that leads to higher prices.
- Second, it can be in a state where supply exceeds demand which means there is competition to sell and this leads to declining prices.
- Third, it can be in a state of equilibrium. At equilibrium, there is no competition to buy or sell because the market is at a price where everyone can buy or sell as much as they want. However, as the market moves away from equilibrium, competition increases which forces price back to equilibrium. In other words, competition eliminates itself by forcing markets back to equilibrium.
The greater the supply and demand imbalance, the greater the opportunity
This is true when buying and selling anything, not just with your investments. While many "professionals" would have you diversify your portfolio by buying many different stocks or a "ladder" of bonds for example, a much more efficient, lower risk/higher reward approach is to identify the markets with the greatest supply/demand imbalance and risk your hard earned capital there. This is not all that different from stretching a rubber band. The more you stretch it, the more potential energy is stored, waiting until it reaches a threshold where that energy is released and it snaps back. The thresholds in markets where prices turn are the price levels where supply and demand are out of balance, period.
Seeing the supply/demand curve on a price chart
How do we know when we are at these levels, far from equilibrium? Please revert back to the first chart in this piece. Price levels "A" and "C" represent the boundaries of this curve. All you have to do is look at a larger time frame chart (or smaller if you're an active trader) and do the following:
- Identify current price.
- Identify the demand level below current price. This level represents the lower boundary of the supply and demand curve.
- Identify the supply level above current price. This level represents the upper boundary of the supply and demand curve.
The Problems with Conventional Portfolio Diversification
For most investors, your portfolio is split between stocks and bonds. Whatever the split is, have you ever realized that almost every investment in a typical portfolio appreciates only when prices go up? What happens if these markets go down for a significant period like they did in Japan for over 10 years? And worse, what happens if this decline in price begins when you are near retirement?
When we break down portfolio diversification in stocks, there is another issue to be aware of. Your average investor will typically be told to reduce risk by investing portions of their portfolio in different stock sectors and markets. An example would be to have a portion of your stock portfolio in Dow stocks which are typically large cap stocks and a portion in the tech heavy NASDAQ market.
At first glance, these two charts appear to be the same chart. During almost any period in time, equity markets move in the same general direction. As you can see here, diversifying in these two markets is really not decreasing risk, it is actually increasing risk. The average investor thinks their hard earned capital is diversified properly between two semi-uncorrelated markets but the truth is, the risk is actually DOUBLED as these markets almost always move in the same direction. Again, conventional diversification is typically risk-disguised as opportunity for the ill-informed investor. These days, it is also very uncommon for a foreign equity market to move in the opposite direction of the major U.S. markets for any sustained period of time.
Proper Diversification According to the Laws of Supply and Demand
Ok, enough questions and alarming issues. Let's use pure supply and demand and learn how to properly diversify your portfolio. Notice the charts above. Here, we are looking at the same period of time in the S&P 500 and the 30 Year Bond. Area "A" in the S&P chart represents a major supply level for reasons mentioned prior in this piece. "B" is the first time price revisits that area of imbalance which is where we would want to sell for profits or initiate a short position. Let's take a look at the 30 Year Bond chart. Area "A" represents a major demand level, again, for reasons discussed earlier in this piece. "B" represents the low risk/high reward time to buy into the Bond market.
Take action when risk is lowest and reward is highest
As you can see, at the exact same period of time, the S&P begins its huge decline and the Bonds begin their enormous rise. The proper play for the astute diversifier is to take profits (sell) on much if not all of your stock holdings and buy into the bond market. This is how we diversify our portfolio based on the laws of supply and demand.
No matter how diverse your stock holdings were during that decline in the S&P, you likely lost plenty of your investment capital. Had you listened to the whispers of Adam Smith and focused on pure supply and demand, the move from stocks to bonds was very clear. Don't let the illusions of conventional thought obscure what is truly a simple reality that anyone can understand and apply.
Last edited by a moderator: