For daytraders and scalpers looking for a quick trades or even a bit longer hold from 5 minutes to 1 hour, it's not easy to do. When day trading stocks, not knowing which way the market will go or the sentiment of the next few minutes is the fastest way to go broke. So watching the breadth such as the composites such as NASDAQ, DOW, or S&P 500 is a fundamental tool used to day trade effectively. Getting an idea what the immediate sentiment is crucial is seeing when and where the buyers or sellers are coming. Believe it or not, stocks are not islands and are not random. Participants move in and out for reasons others prices of stocks. There is always a correlation to some type of data, be it news or other related stocks. So finding a reason behind the move can be a provide an edge for traders.
There is an important indicator that can lead the stocks to move in certain ways. Monitoring the breadth of the big players and watching the movements of the collection of large cap stocks that influence the stock a trader wants to trade. The NYSE TICK indicator takes all the stocks in that exchange and shows how many is ticking up compared to those ticking down. For example, at one moment, 500 stocks are moving up while 400 is moving down, the reading would be +100. So the uptrend momentum occurs when it's in the positive number while a downtrend tendency occurs when the number shows a negative reading.
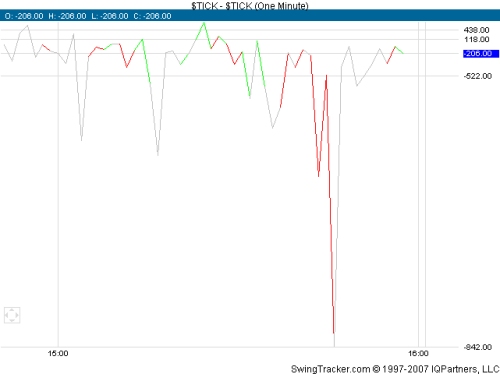
caption: Figure 1 NYSE $Tick chart displaying the values and the reading of the sentiments of the market to the second.
So how does one use this indicator to increase his advantage is profiting from the market? The first task is to analyze what is the immediate trend in the last hour or last few hours (depending on the timeframe used, 5-, 15-, 60-minute or some other). The way to determine the trend is determining pivots such as higher highs and lows for uptrend or lower highs and lows for downtrend (please refer to price action article for further reading into the subject).
Now once the short term trend has been established, we look at the NYSE TICK chart to find the setup. The best entry as everyone knows is buy/short the pullbacks. We turn to the $TICK chart to look for one extreme of the reading to find the right spot to trade. If the stock is in an uptrend, we look for an extreme negative reading to go long; when it turns upwards, we take a long entry. If the stock is in a downtrend, we look for an extreme positive reading to go short; when it begins turning down, we go short. Let's take an example.
Looking at RIMM chart, we established that the trend has been down since the opening bell this morning.
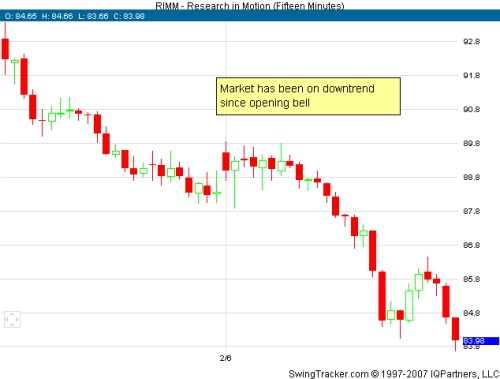
caption: Figure 2.
Now, we look at the $TICK chart, at 3:25pm, the $TICK moves into positive reading.
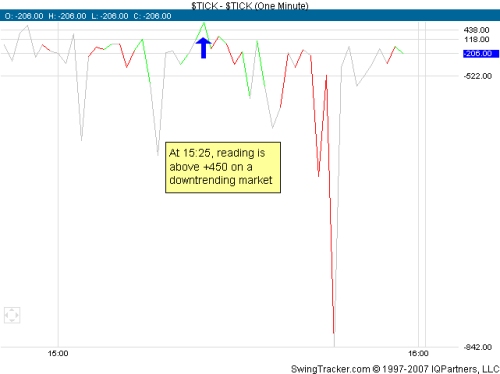
caption: Figure 3.
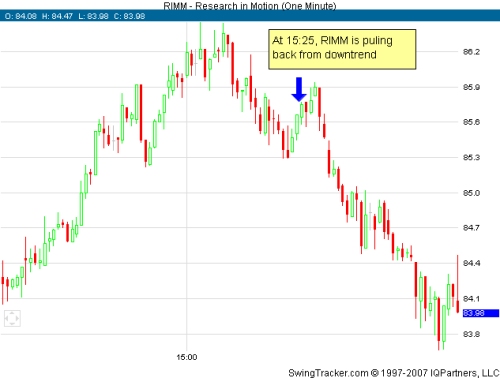
We look at the stock and see what it's doing.
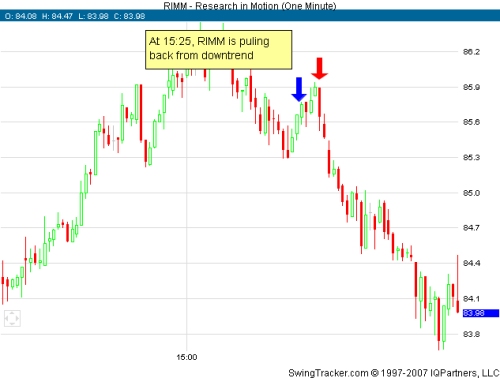
caption: Figure 4.
At 3:25pm on RIMM chart, the stock has been retracing from its downtrend, a pullback entry is imminent. When the $TICK finally turned down toward a negative reading, around 3:26 or 3:27pm.
caption: Figure 5.
With the confirmation of the price action, breaking the low of the previous bar at 3:29pm, a short entry is taken (red down arrow in figure 5).
TICK indicator is a very useful is used properly because it takes time and experience to know use it with price action. Many times, the TICK will divert from price action of the individual stocks or instruments. Knowing what to do when they diverge can prevent losses from occurring. Practice and screen time is that is needed to become profitable with it.
There is an important indicator that can lead the stocks to move in certain ways. Monitoring the breadth of the big players and watching the movements of the collection of large cap stocks that influence the stock a trader wants to trade. The NYSE TICK indicator takes all the stocks in that exchange and shows how many is ticking up compared to those ticking down. For example, at one moment, 500 stocks are moving up while 400 is moving down, the reading would be +100. So the uptrend momentum occurs when it's in the positive number while a downtrend tendency occurs when the number shows a negative reading.
caption: Figure 1 NYSE $Tick chart displaying the values and the reading of the sentiments of the market to the second.
So how does one use this indicator to increase his advantage is profiting from the market? The first task is to analyze what is the immediate trend in the last hour or last few hours (depending on the timeframe used, 5-, 15-, 60-minute or some other). The way to determine the trend is determining pivots such as higher highs and lows for uptrend or lower highs and lows for downtrend (please refer to price action article for further reading into the subject).
Now once the short term trend has been established, we look at the NYSE TICK chart to find the setup. The best entry as everyone knows is buy/short the pullbacks. We turn to the $TICK chart to look for one extreme of the reading to find the right spot to trade. If the stock is in an uptrend, we look for an extreme negative reading to go long; when it turns upwards, we take a long entry. If the stock is in a downtrend, we look for an extreme positive reading to go short; when it begins turning down, we go short. Let's take an example.
Looking at RIMM chart, we established that the trend has been down since the opening bell this morning.
caption: Figure 2.
Now, we look at the $TICK chart, at 3:25pm, the $TICK moves into positive reading.
caption: Figure 3.
We look at the stock and see what it's doing.
caption: Figure 4.
At 3:25pm on RIMM chart, the stock has been retracing from its downtrend, a pullback entry is imminent. When the $TICK finally turned down toward a negative reading, around 3:26 or 3:27pm.
caption: Figure 5.
With the confirmation of the price action, breaking the low of the previous bar at 3:29pm, a short entry is taken (red down arrow in figure 5).
TICK indicator is a very useful is used properly because it takes time and experience to know use it with price action. Many times, the TICK will divert from price action of the individual stocks or instruments. Knowing what to do when they diverge can prevent losses from occurring. Practice and screen time is that is needed to become profitable with it.
Last edited by a moderator: