Given my background as a scalper in the equities market for eight years I am often asked if those same techniques are applicable to the FX market. First, it is important to define how one defines scalping. First, recalling my days as a floor/screen based trader of equities in the 90s the definition was a technique whereby a trader could profit from very short-term moves in the marketplace by using a combination of 1 & 5-minute charts as well as a keen sense of tape reading. When I made the transition to the FX markets exclusively back in 2001-02 I was keenly aware that this type of hyper strategy had 2 shortcomings:
While point 2 may be open to debate, one cannot argue that short-term strategies have a finite amount of capital you can deploy at any point in time without disrupting the market.
So with that in mind, the angle I decided to take on this article was to illustrate how some of the techniques and indicators used in a scalping strategy can still be overlaid on to a swing trading approach in order to maximize entry and exit points. First some assumptions for the forthcoming analysis:
There are limitations, as with any technical approach that combines a fair degree of discretion as rigid entry guidelines may prevent a trade from being executed. However the effectiveness and precision of the entry techniques will typically avoid costly draw-downs while the trade is playing out.
Here is an ideal example of using a big picture viewpoint/analysis, but drilling down to a lower time frame in order to pinpoint the entry in an attempt to execute at a price that will perhaps provide immediate validation.
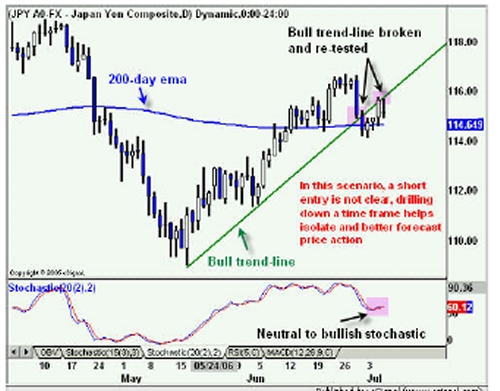
In this instance I am anticipating that a retest of the bull trendline will fail, however, the "ideal" scenario is to have the daily stochastic pointing down in order to have bearish momentum at our back. As you can see from the daily chart above, this is not the case. However, what if we could speed up the analysis in terms of drilling down a time frame or two and essentially forecast the turning of that stochastic lower?
I rely heavily upon on the 60 & 240-minute in order to execute trades while frequently doing the analysis on the daily chart. Referring to the 240-minute chart below, it provides an ideal example of using the lower time frame for execution. Note the following:
If there is one question mark on this entry it is that the current trend on the 240-minute chart that is up. Trend is defined by 2 parameters:
Ideally, for shorts, price bars are below a downward sloping moving average and vice versa for longs.
</font /></font />
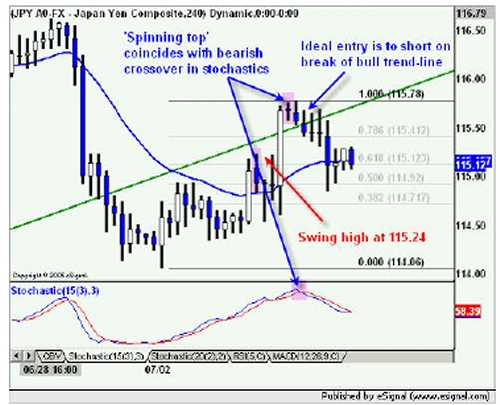
So now what, where do we take profits? In this case, given that the trend is up on the time frame that we used for execution there is not the luxury of letting the trade ride. In this instance, the logical exit points are seen at either the 50% fib retracement at 115.12 or the swing high at 115.24. These levels are easily achieved.
AUD/NZD Short
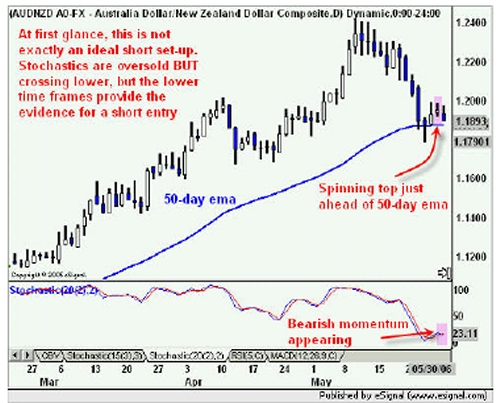
This cross has been "in play" this year and continues to be a cross I have relied upon frequently. In this scenario we have a situation where the daily chart suggests a possible short, but does not provide all the points on the checklist for a high probability short.
Regardless of the trade, I always respect the time frame that the trade was executed on. In this case, the execution was based on analysis of the 240-minute chart, as a result, exit points also need to be calculated from the same time frame.
Given that our first target was 1.1740 we still want to give the chance for the trade to play out, however, given that the trade is in roughly 100 pips in the money and the stochastic suggest that the selling pressure is waning, it is prudent to take some of the trade off and adjust stop-loss to either break-even or some price that suits the traders risk tolerance, a trailing stop is ideal.
NZD/SEK Short
The chart below provides a perfect example of two time frames coming together that isolate a fantastic short opportunity. In this case, the daily chart is already confirmed as bearish, now, it is just a matter of isolating the entry point as a way to avoid the trade going against you while waiting for the downward trend to resume. Until the 60-minute charts stochastic roll back over prices are likely to drift higher. The better entry is to wait for pullback into fibonacci resistance at 5.2450-5.2500 and waiting for bearish momentum to resume by way of a stochastic cross.
AUD/JPY Long
All of the above points were met and prices did move right into the target price at 85.60
Looking Ahead
While it is too early to offer any short-term analysis, the daily chart of USD/JPY will likely provide traders an ideal short entry for both longer-term and short-term traders.
- It was not scalable
- A scalping technique may not be conducive to the FX markets
While point 2 may be open to debate, one cannot argue that short-term strategies have a finite amount of capital you can deploy at any point in time without disrupting the market.
So with that in mind, the angle I decided to take on this article was to illustrate how some of the techniques and indicators used in a scalping strategy can still be overlaid on to a swing trading approach in order to maximize entry and exit points. First some assumptions for the forthcoming analysis:
- Trade selection is done using one of or a combination of a 60 & 240-min charts as well as a daily chart. A weekly chart is used merely as a way to identify long-term support and resistance areas.
- I will discuss several indicators, mainly stochastics, fibonacci retracements and extensions, trend-lines and RSI, Elliot Wave analysis
- Trade duration average is several days
- I rely upon not only the G10 pairs but also several crosses
- Risk is defined in advance of each trade and lot size is calculated based on stop-loss
There are limitations, as with any technical approach that combines a fair degree of discretion as rigid entry guidelines may prevent a trade from being executed. However the effectiveness and precision of the entry techniques will typically avoid costly draw-downs while the trade is playing out.
Here is an ideal example of using a big picture viewpoint/analysis, but drilling down to a lower time frame in order to pinpoint the entry in an attempt to execute at a price that will perhaps provide immediate validation.
In this instance I am anticipating that a retest of the bull trendline will fail, however, the "ideal" scenario is to have the daily stochastic pointing down in order to have bearish momentum at our back. As you can see from the daily chart above, this is not the case. However, what if we could speed up the analysis in terms of drilling down a time frame or two and essentially forecast the turning of that stochastic lower?
I rely heavily upon on the 60 & 240-minute in order to execute trades while frequently doing the analysis on the daily chart. Referring to the 240-minute chart below, it provides an ideal example of using the lower time frame for execution. Note the following:
- Spinning top suggests a reversal is imminent
- Stochastic cross lower igniting bearish momentum
- Trend-line break (115.53) triggers ideal entry
If there is one question mark on this entry it is that the current trend on the 240-minute chart that is up. Trend is defined by 2 parameters:
- What is the slope of the 20-period ema over the last half a dozen bars?
- Are price bars above or below the ema?
Ideally, for shorts, price bars are below a downward sloping moving average and vice versa for longs.
</font /></font />
So now what, where do we take profits? In this case, given that the trend is up on the time frame that we used for execution there is not the luxury of letting the trade ride. In this instance, the logical exit points are seen at either the 50% fib retracement at 115.12 or the swing high at 115.24. These levels are easily achieved.
AUD/NZD Short
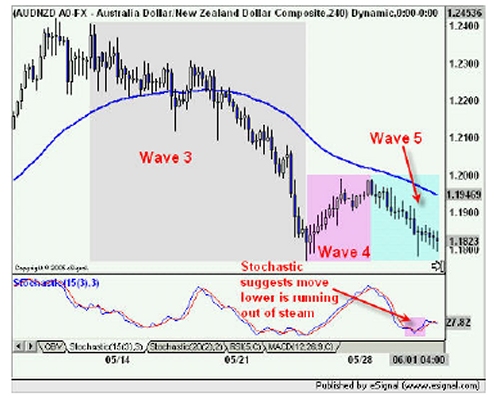
This cross has been "in play" this year and continues to be a cross I have relied upon frequently. In this scenario we have a situation where the daily chart suggests a possible short, but does not provide all the points on the checklist for a high probability short.
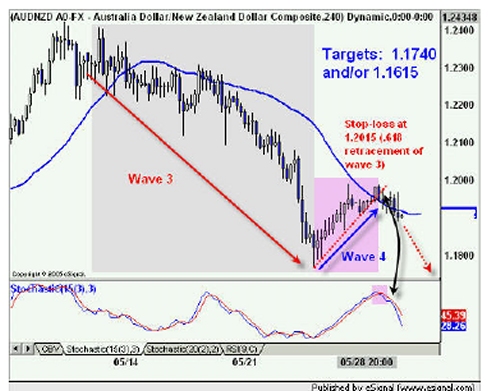
- Wave 4 completion is confirmed by a stochastic cross lower and a trend-line break
- Price targets are calculated by a simple fibonacci extension of wave 3 using a 1.25 and 1.50 setting
Regardless of the trade, I always respect the time frame that the trade was executed on. In this case, the execution was based on analysis of the 240-minute chart, as a result, exit points also need to be calculated from the same time frame.
Given that our first target was 1.1740 we still want to give the chance for the trade to play out, however, given that the trade is in roughly 100 pips in the money and the stochastic suggest that the selling pressure is waning, it is prudent to take some of the trade off and adjust stop-loss to either break-even or some price that suits the traders risk tolerance, a trailing stop is ideal.
NZD/SEK Short
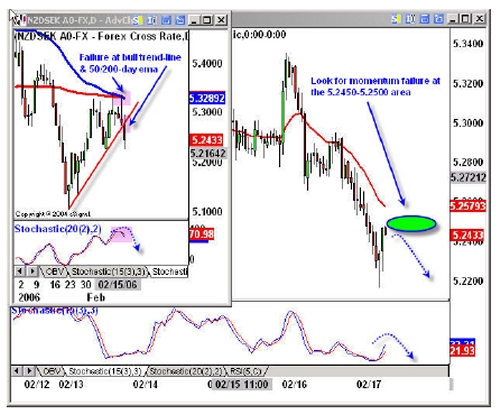
The chart below provides a perfect example of two time frames coming together that isolate a fantastic short opportunity. In this case, the daily chart is already confirmed as bearish, now, it is just a matter of isolating the entry point as a way to avoid the trade going against you while waiting for the downward trend to resume. Until the 60-minute charts stochastic roll back over prices are likely to drift higher. The better entry is to wait for pullback into fibonacci resistance at 5.2450-5.2500 and waiting for bearish momentum to resume by way of a stochastic cross.
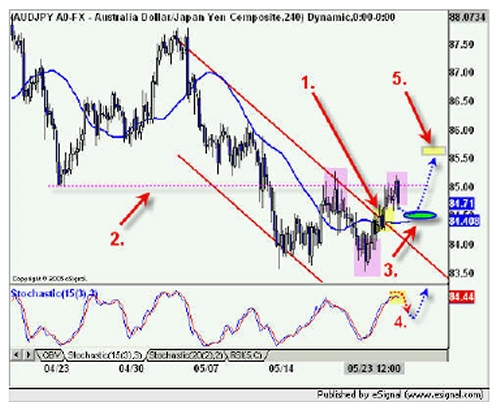
AUD/JPY Long
- Bear trend-channel is broken.
- Prices fail at swing low at 85.00 and form right shoulder of inverted head & shoulders pattern.
- A fibonacci retracement of the move higher from 5/23 offers the "ideal" long entry point for a test to break the neckline.
- Stochastic is expected to pullback; turn higher confirming point number 3.
- If all points above are confirmed the target price has a solid chance of being hit.
All of the above points were met and prices did move right into the target price at 85.60
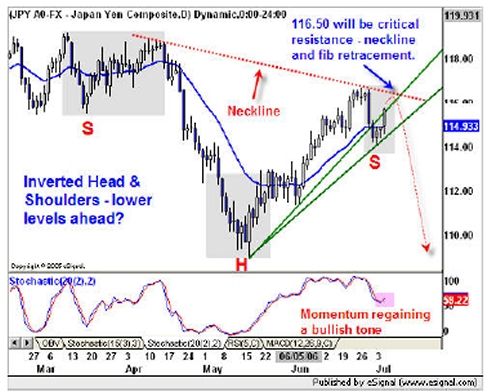
Looking Ahead
While it is too early to offer any short-term analysis, the daily chart of USD/JPY will likely provide traders an ideal short entry for both longer-term and short-term traders.
Last edited by a moderator: